
Extreme Temperature Events
and Heatwaves
Figure 1 This weather map shows the geographical extent of the June 2021 Western North America Heatwave on June 29, 2021. Maximum temperatures data is shown as an anomaly from the 1979 to 2000 baseline average in degrees Fahrenheit.
Introduction
Human-caused climate change is causing an upward shift in the entire temperature distribution, leading to an increase in extreme maximum daily temperatures and heatwaves. This shift amplifies the frequency, duration, and intensity of hot temperature extremes. The scientific evidence is overwhelmingly strong, indicating that many of the hottest temperature events in the last decade would have been virtually impossible without anthropogenic greenhouse gas emissions. We are transitioning from a climate where extreme heat was an unusual occurrence to one where it has become a defining feature of our weather.
Even small increments of global warming cause statistically significant increases in hot extremes across our planet. Table 1 describes how the level global warming, relative to pre-industrial times, influences the frequency and intensity of extreme heat events.
Table 1 Global warming level and predicted changes in the frequency and intensity of extreme heat events (Source: IPCC, 2021).
Currently, the annual mean global surface temperature is about 1.5°C warmer than it was in pre-industrial times (before 1700).
Heatwaves
A heatwave is normally defined as several consecutive days of unusually hot weather relative to the local climate. Heatwaves are not just summer weather events, they can occur in spring, autumn, and even winter if temperatures rise far above what’s normal for that time of year. Heatwave events can occur anywhere, and climate change is increasing their frequency, duration, and magnitude worldwide.
The June 2021 Western North America Heatwave
At the end of June 2021 an intense heatwave developed over British Columbia, Washington State, and Oregon (Figure 1). This heatwave would have been virtually impossible without human-induced climate change. Statistical analysis of extreme daytime temperatures recorded at weather stations indicated it was among the most extreme climate events ever seeen globally (Thompson et al., 2022 and White et al., 2023). This heatwave had devastating consequences across various sectors, resulting in hundreds of fatalities, mass mortality of marine life, significant crop and livestock losses, rapid snow and glacier melting that triggered flooding, a substantial increase in wildfires, and post-wildfire debris flows and landslides that caused infrastructure damage.
Listed below is more information on the various types of impacts of the June 2021 Western North America Heatwave as described in White el al., 2023.
Human Health Impacts
Coastal and Marine Ecosystem Impacts
Wildfire and Smoke Impacts
Agricultural and Livestock Impacts
Cryosphere, Hydrology, and Flooding Impacts
Cascading Landslide/Debris-flow Impacts
The June 2021 heatwave resulted in Kelowna experiencing record-breaking daily maximum temperatures for several consecutive days (Figure 2). Notably, the highest temperature reached 44.6°C on June 29, 2021 (Airport weather station, 45.7°C at the University of British Columbia - Okanagan weather station). Several of Kelowna’s daily highs during the period from June 26 to 30 were exceptionally rare, occurring with a probability of at least 1 in 1,000 compared to the historical record from 1951 to 2000.
Figures 3, 4, and 5 show the recorded daily maximum temperatures from June 15 to July 5, 2021 for Penticton, Summerland, andd Vernon, respectively.
Human Health Response to Heat Stress
Xu et al. 2025 comprehensive review, published in the journal BMJ, outlines the evidence on how extreme heat induces systemic and organ-specific damage. The researchers explained how heat stress triggers a series of physiological responses. Dilation of the blood vessels redirects blood flow to the skin for cooling, which increases cardiac output and puts strain on the cardiovascular system. Changes in blood viscosity raise the risk of thrombosis. Systemic inflammatory responses are activated, and the gut barrier’s integrity is compromised, potentially allowing endotoxins to enter the bloodstream. These mechanisms lead to shifts in disease profiles, including acute heat-related illnesses, cardiovascular events, renal disorders, and other conditions, with susceptibility ranging from prenatal stages to old age.
Extreme heat places profound stress on the cardiovascular system. To facilitate heat dissipation through the skin, cardiac output must increase substantially, by as much as 2–3 liters per minute, while dilation of the blood vessels reduces central blood volume and pressure. This compensatory response is particularly dangerous for individuals with pre-existing cardiovascular conditions, who may lack the cardiac reserve to meet these demands. Heat stress not only triggers acute events such as myocardial infarction and stroke but also exacerbates chronic conditions including heart failure and arrhythmias through inflammatory and prothrombotic pathways (Singh et al. 2024).
Heat stress poses a growing threat to kidney health through various mechanisms. Dehydration, intensified by excessive sweating and insufficient fluid intake, diminishes renal perfusion and elevates the risk of acute kidney injury (AKI). In a recent article published in Kidney Medicine, Mohammed and Nashwan (2025) highlighted the escalating global concern surrounding heat stress and kidney injury. They emphasized that recurrent episodes of subclinical AKI could potentially contribute to the development of chronic kidney disease over time. Notably, the emergence of Chronic Kidney Disease Of Unknown Etiology (CKDu) among outdoor workers in tropical regions is particularly alarming. These individuals, including agricultural laborers, construction workers, and others, endure prolonged occupational heat exposure without adequate hydration or rest.
Extreme heat intensifies respiratory conditions through both direct and indirect mechanisms. Firstly, high temperatures lead to the formation of ground-level ozone through photochemical reactions, deteriorating air quality and causing respiratory distress in vulnerable individuals. Secondly, hotter and drier conditions increase the frequency and intensity of wildfires, which generate particulate matter and smoke that can travel thousands of kilometers, impacting respiratory health in distant populations. The Lancet Countdown 2025 report revealed that fine particle pollution (PM2.5) from wildfire smoke resulted in a staggering 154,000 deaths in 2024, marking a 36% increase compared to the annual average from 2003 to 2012 (Romanello et al., 2025).
An often overlooked aspect of the health effects of heat is its impact on sleep. A study by Obradovich et al. (2017) revealed that higher nighttime temperatures exacerbate sleep deprivation, with the most significant effects observed during the summer months and among lower-income and elderly individuals. Sleep disruption has far-reaching consequences, affecting physical and mental health, cognitive function, and workplace productivity.
References
IPCC. 2021. Climate Change 2021: The Physical Science Basis. Contribution of Working Group I to the Sixth Assessment Report of the Intergovernmental Panel on Climate Change [Masson-Delmotte, V., P. Zhai, A. Pirani, S.L. Connors, C. Péan, S. Berger, N. Caud, Y. Chen, L. Goldfarb, M.I. Gomis, M. Huang, K. Leitzell, E. Lonnoy, J.B.R. Matthews, T.K. Maycock, T. Waterfield, O. Yelekçi, R. Yu, and B. Zhou (eds.)]. Cambridge University Press, Cambridge, United Kingdom and New York, NY, USA, 2391 pp.
Mohammed, A. Y., & Nashwan, A. J. (2025). Heat stress and kidney injury: A growing concern amidst climate change. Kidney Medicine, 8(2), 101215. https://doi.org/10.1016/j.xkme.2025.101215
Obradovich, N., Migliorini, R., Mednick, S. C., & Fowler, J. H. (2017). Nighttime temperature and human sleep loss in a changing climate. Science Advances, 3 (5), e1601555. https://doi.org/10.1126/sciadv.1601555
Romanello, M., Walawender, M., Hsu, S.-C., Moskeland, A., Palmeiro-Silva, Y., Scamman, D., et al. (2025). The 2025 report of the Lancet Countdown on health and climate change: Climate change action offers a lifeline. The Lancet, 406(10521), 2804–2857. https://doi.org/10.1016/ S0140-6736(25)01919-1
Singh, N., Areal, A.T., Breitner, S., Zhang, S., Agewall, S., Schikowski, T., & Schneider, A. (2024). Heat and cardiovascular mortality: Mechanisms and emerging evidence. Circulation Research, 134(9), 1098–1112. https://doi.org/10.1161/CIRCRESAHA.123.323615
Thompson, V., Kennedy-Asser, A.T., Vosper, E., Lo, Y.T.E., Huntingford, C., Andrews, O., Collins, M., Gabrielle C. Hegerl, G.C,. & Mitchell, D. 2022. The 2021 western North America heat wave among the most extreme events ever recorded globally. Science Advances, 8 (18), eabm6860. https://doi.org/10.1126/sciadv.abm6860
White, R.H., Anderson, S., Booth, J.F., Braich, G., Draeger, G., Fei, C., Harley, C.D.G., Henderson, S.B. , Jakob, M., Lau, C.-A., Admasu, L.M., Narinesing, V., Rodell, C., Roocroft, E., Weinberger, K.R., & West, G. 2023. The unprecedented Pacific Northwest heatwave of June 2021. Nature Communications, 14, 727. https://doi.org/10.1038/s41467-023-36289-3
Xu, J., Wang, Q., Anikeeva, O., Zhu, P., Bi, P., & Huang, C. (2025). Effects of extreme heat on physiology, morbidity, and mortality under climate change: Mechanisms and clinical implications. BMJ, 391, e084675. https://doi.org/10.1136/bmj-2025-084675
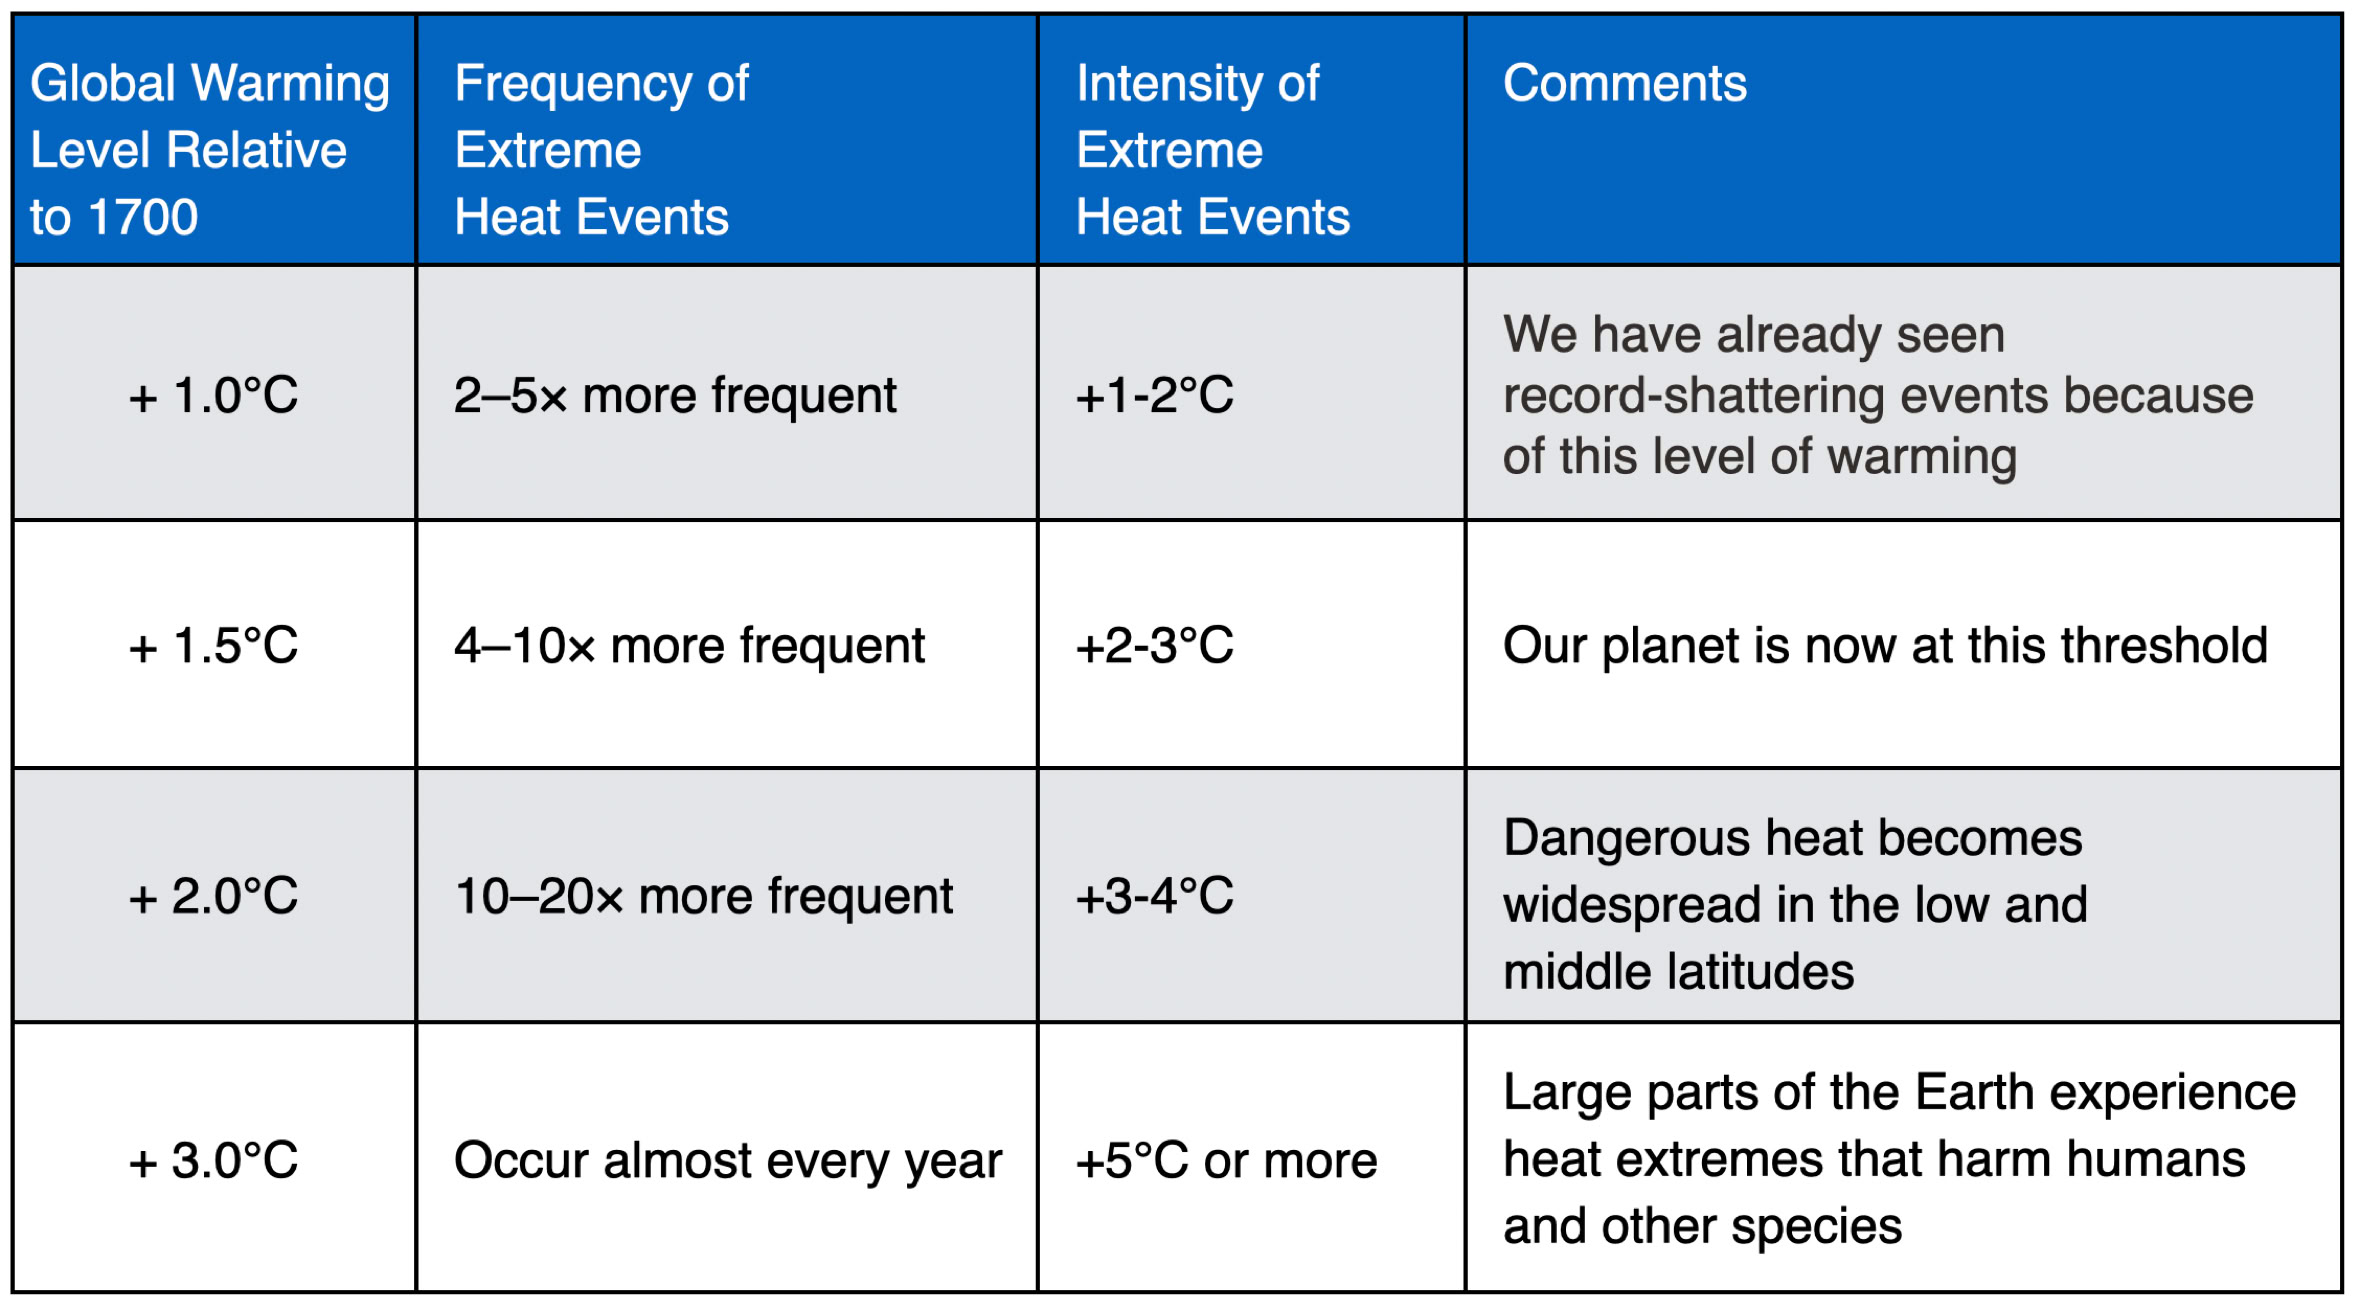
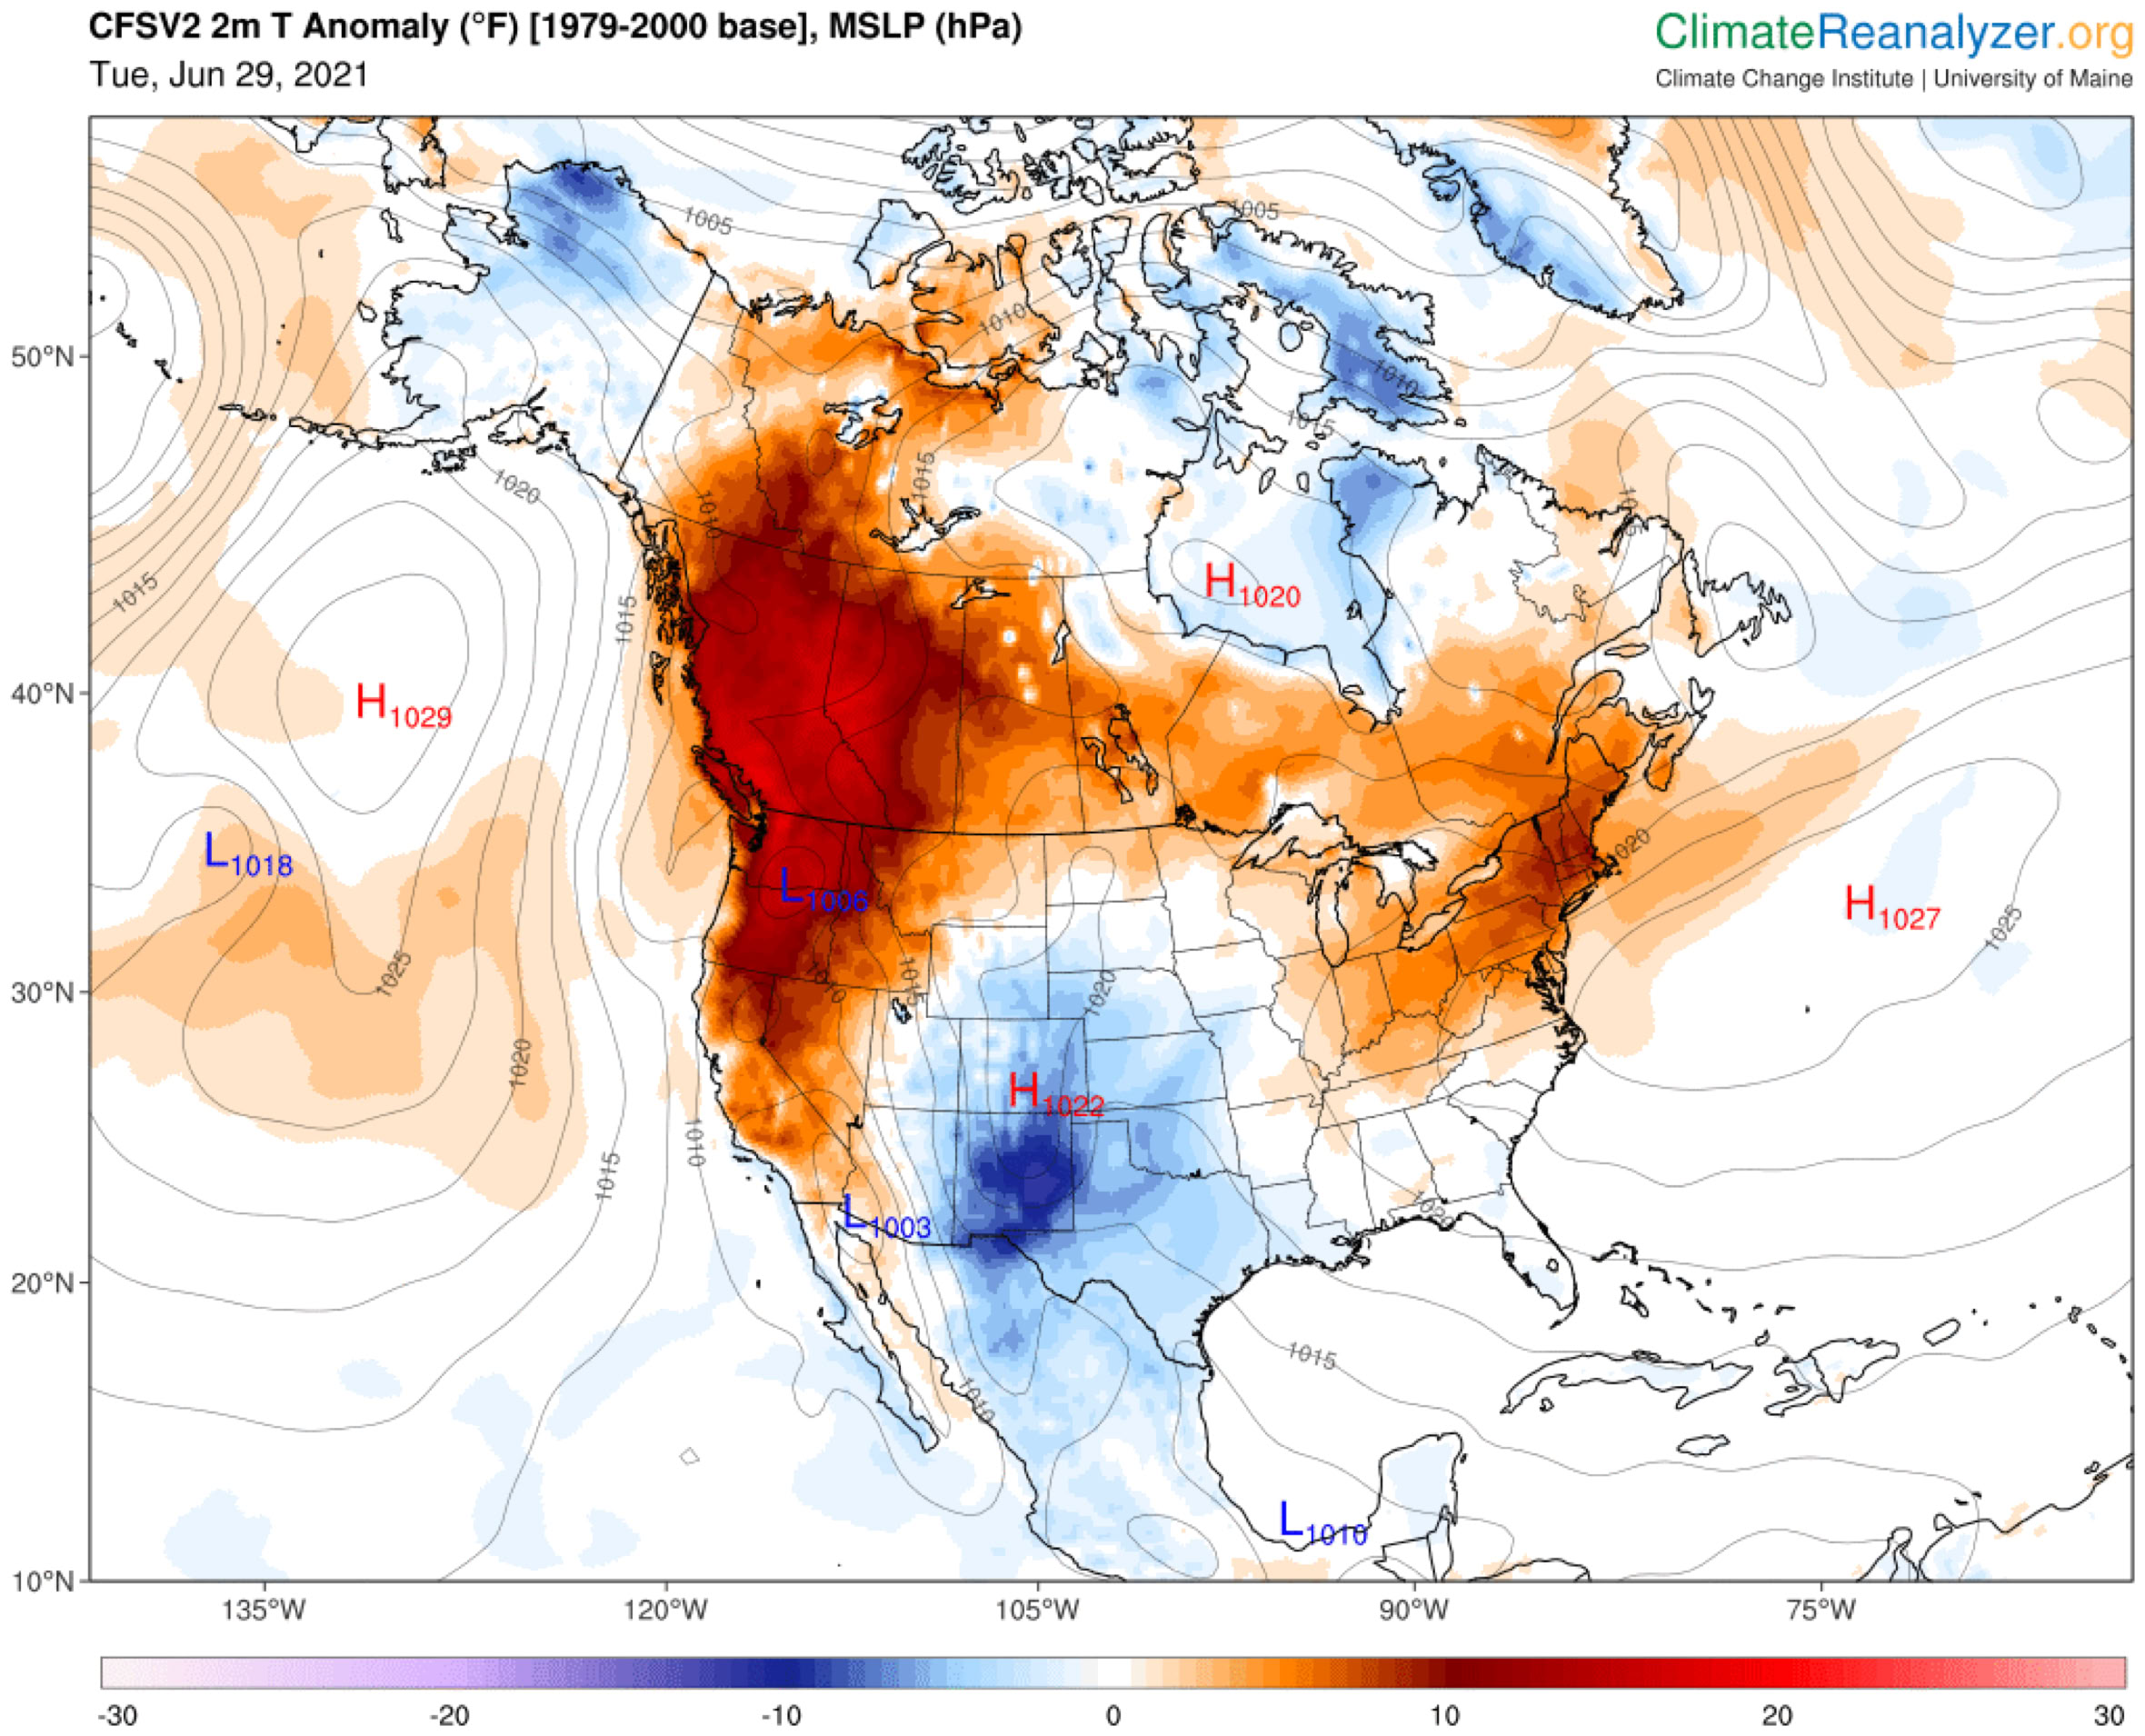
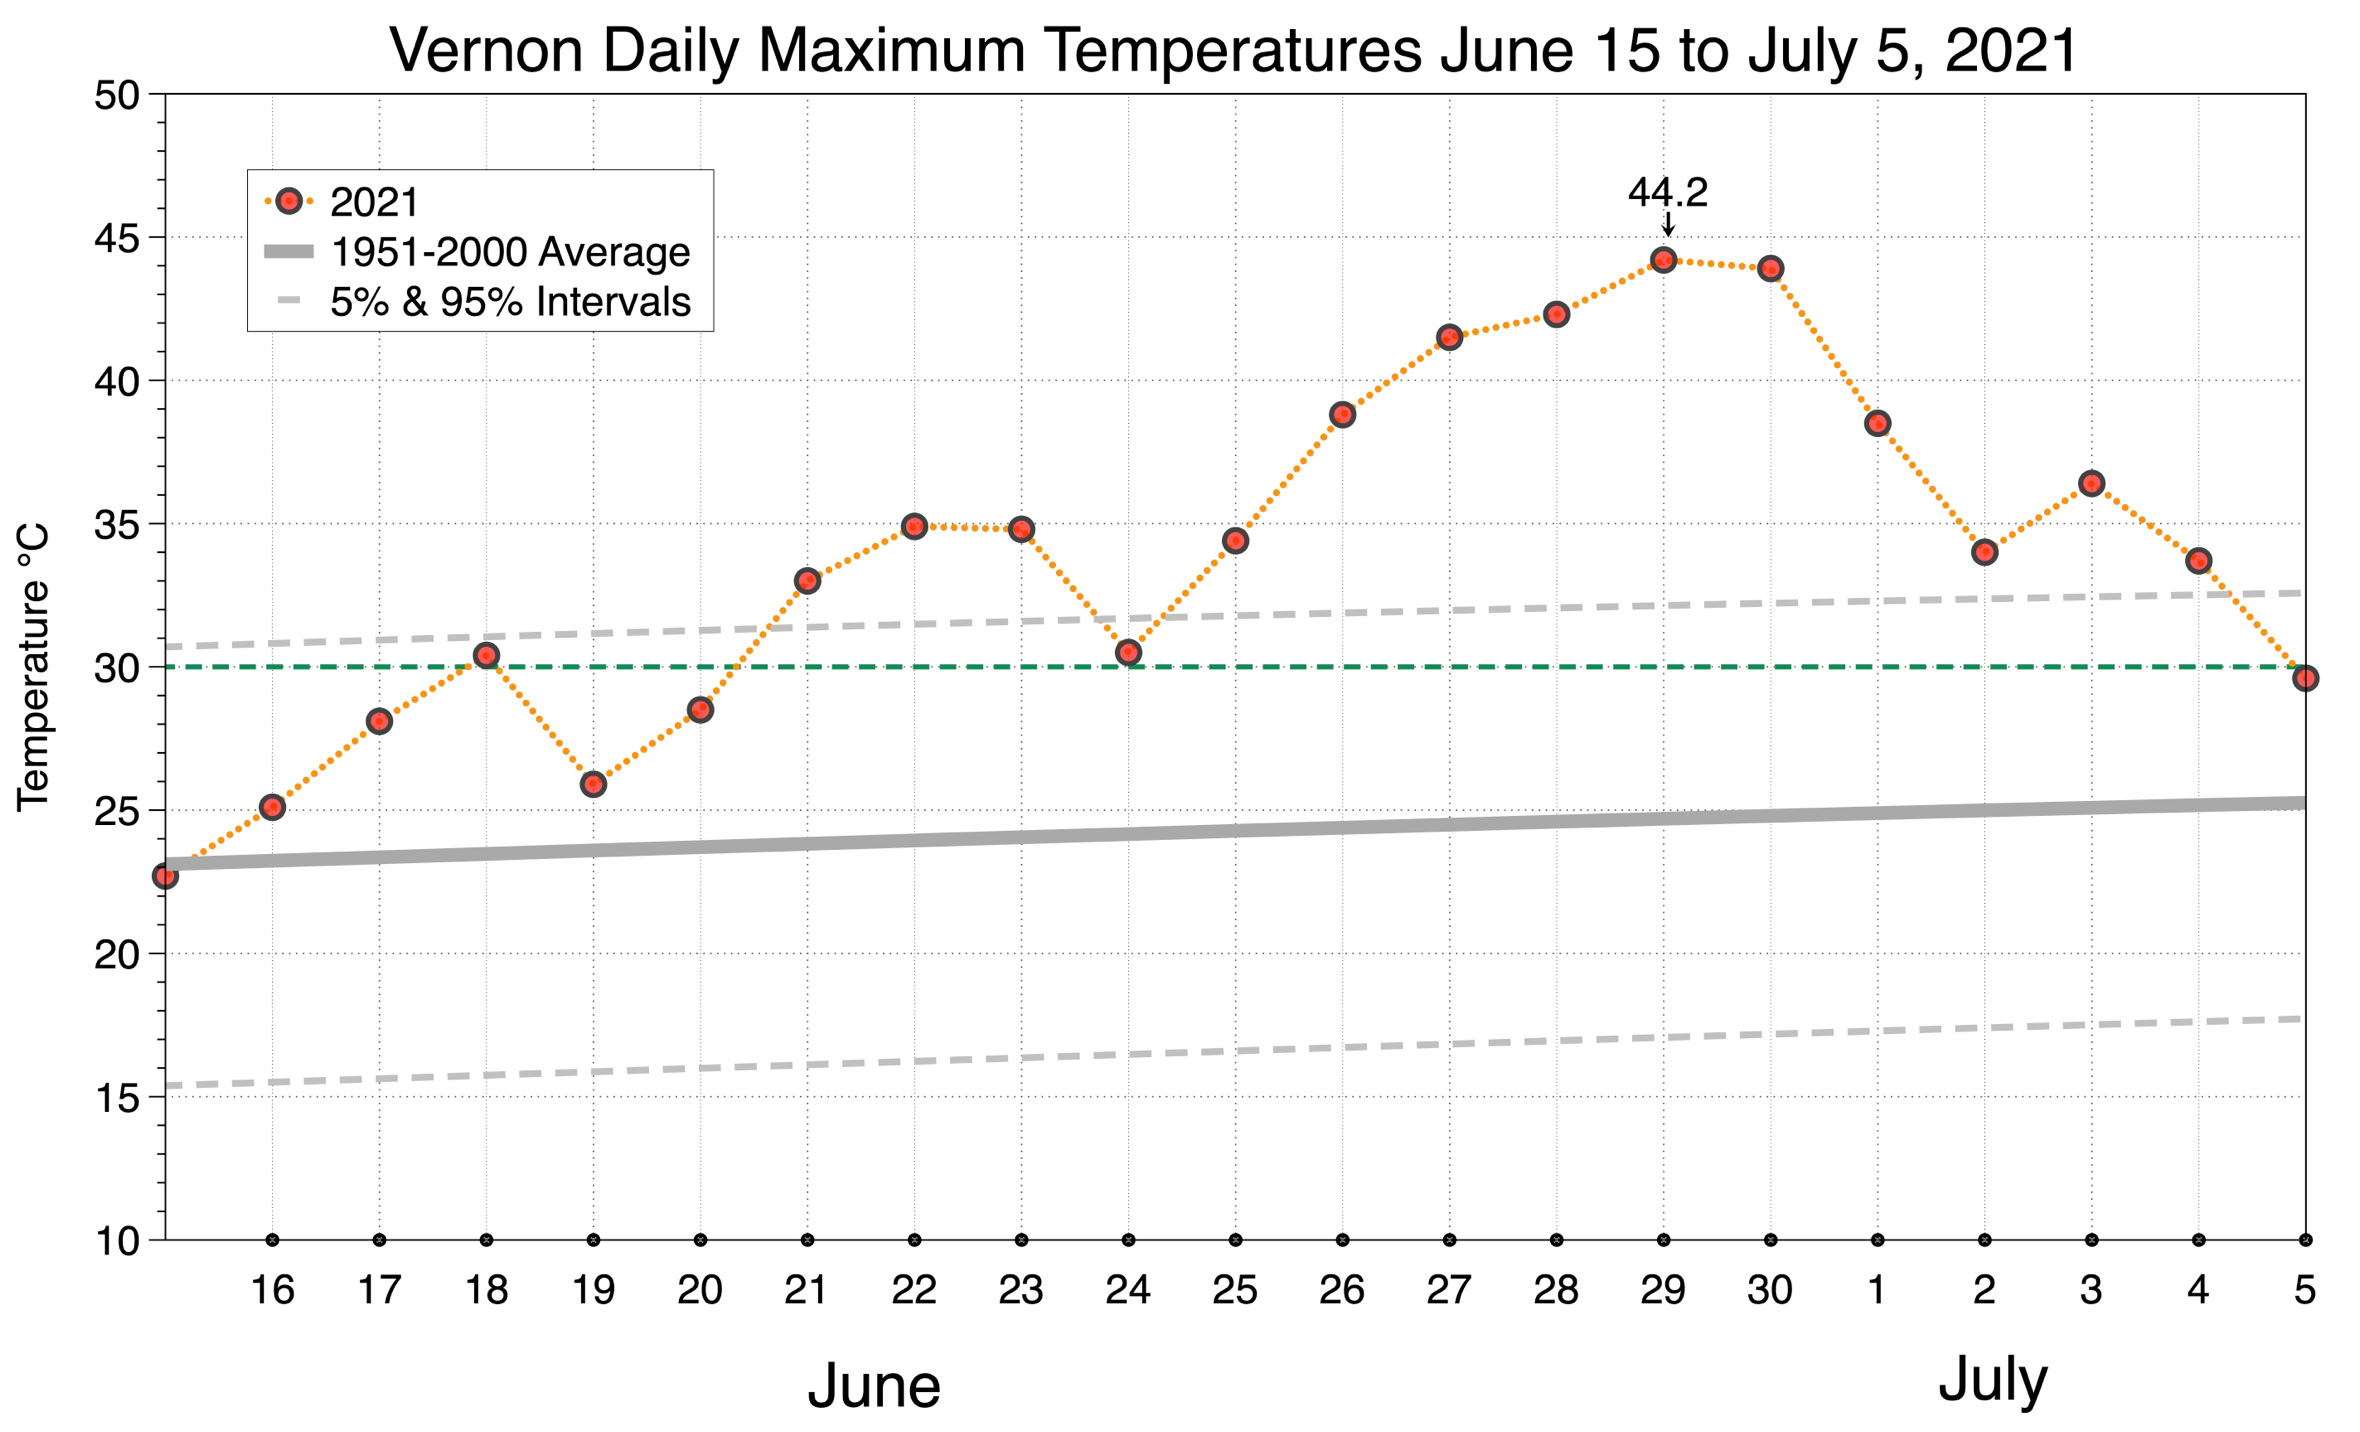
Figure 4 Recorded daily maximum temperatures at Vernon from June 15 to July 5, 2021. Highest recorded temperature occurred on June 29 at 44.2°C. Green dashed line shows the 30°C threshold.

Figure 2 Recorded daily maximum temperatures at Kelowna (airport) from June 15 to July 5, 2021. Highest recorded temperature occurred on June 29 at 44.6°C. Green dashed line shows the 30°C threshold.
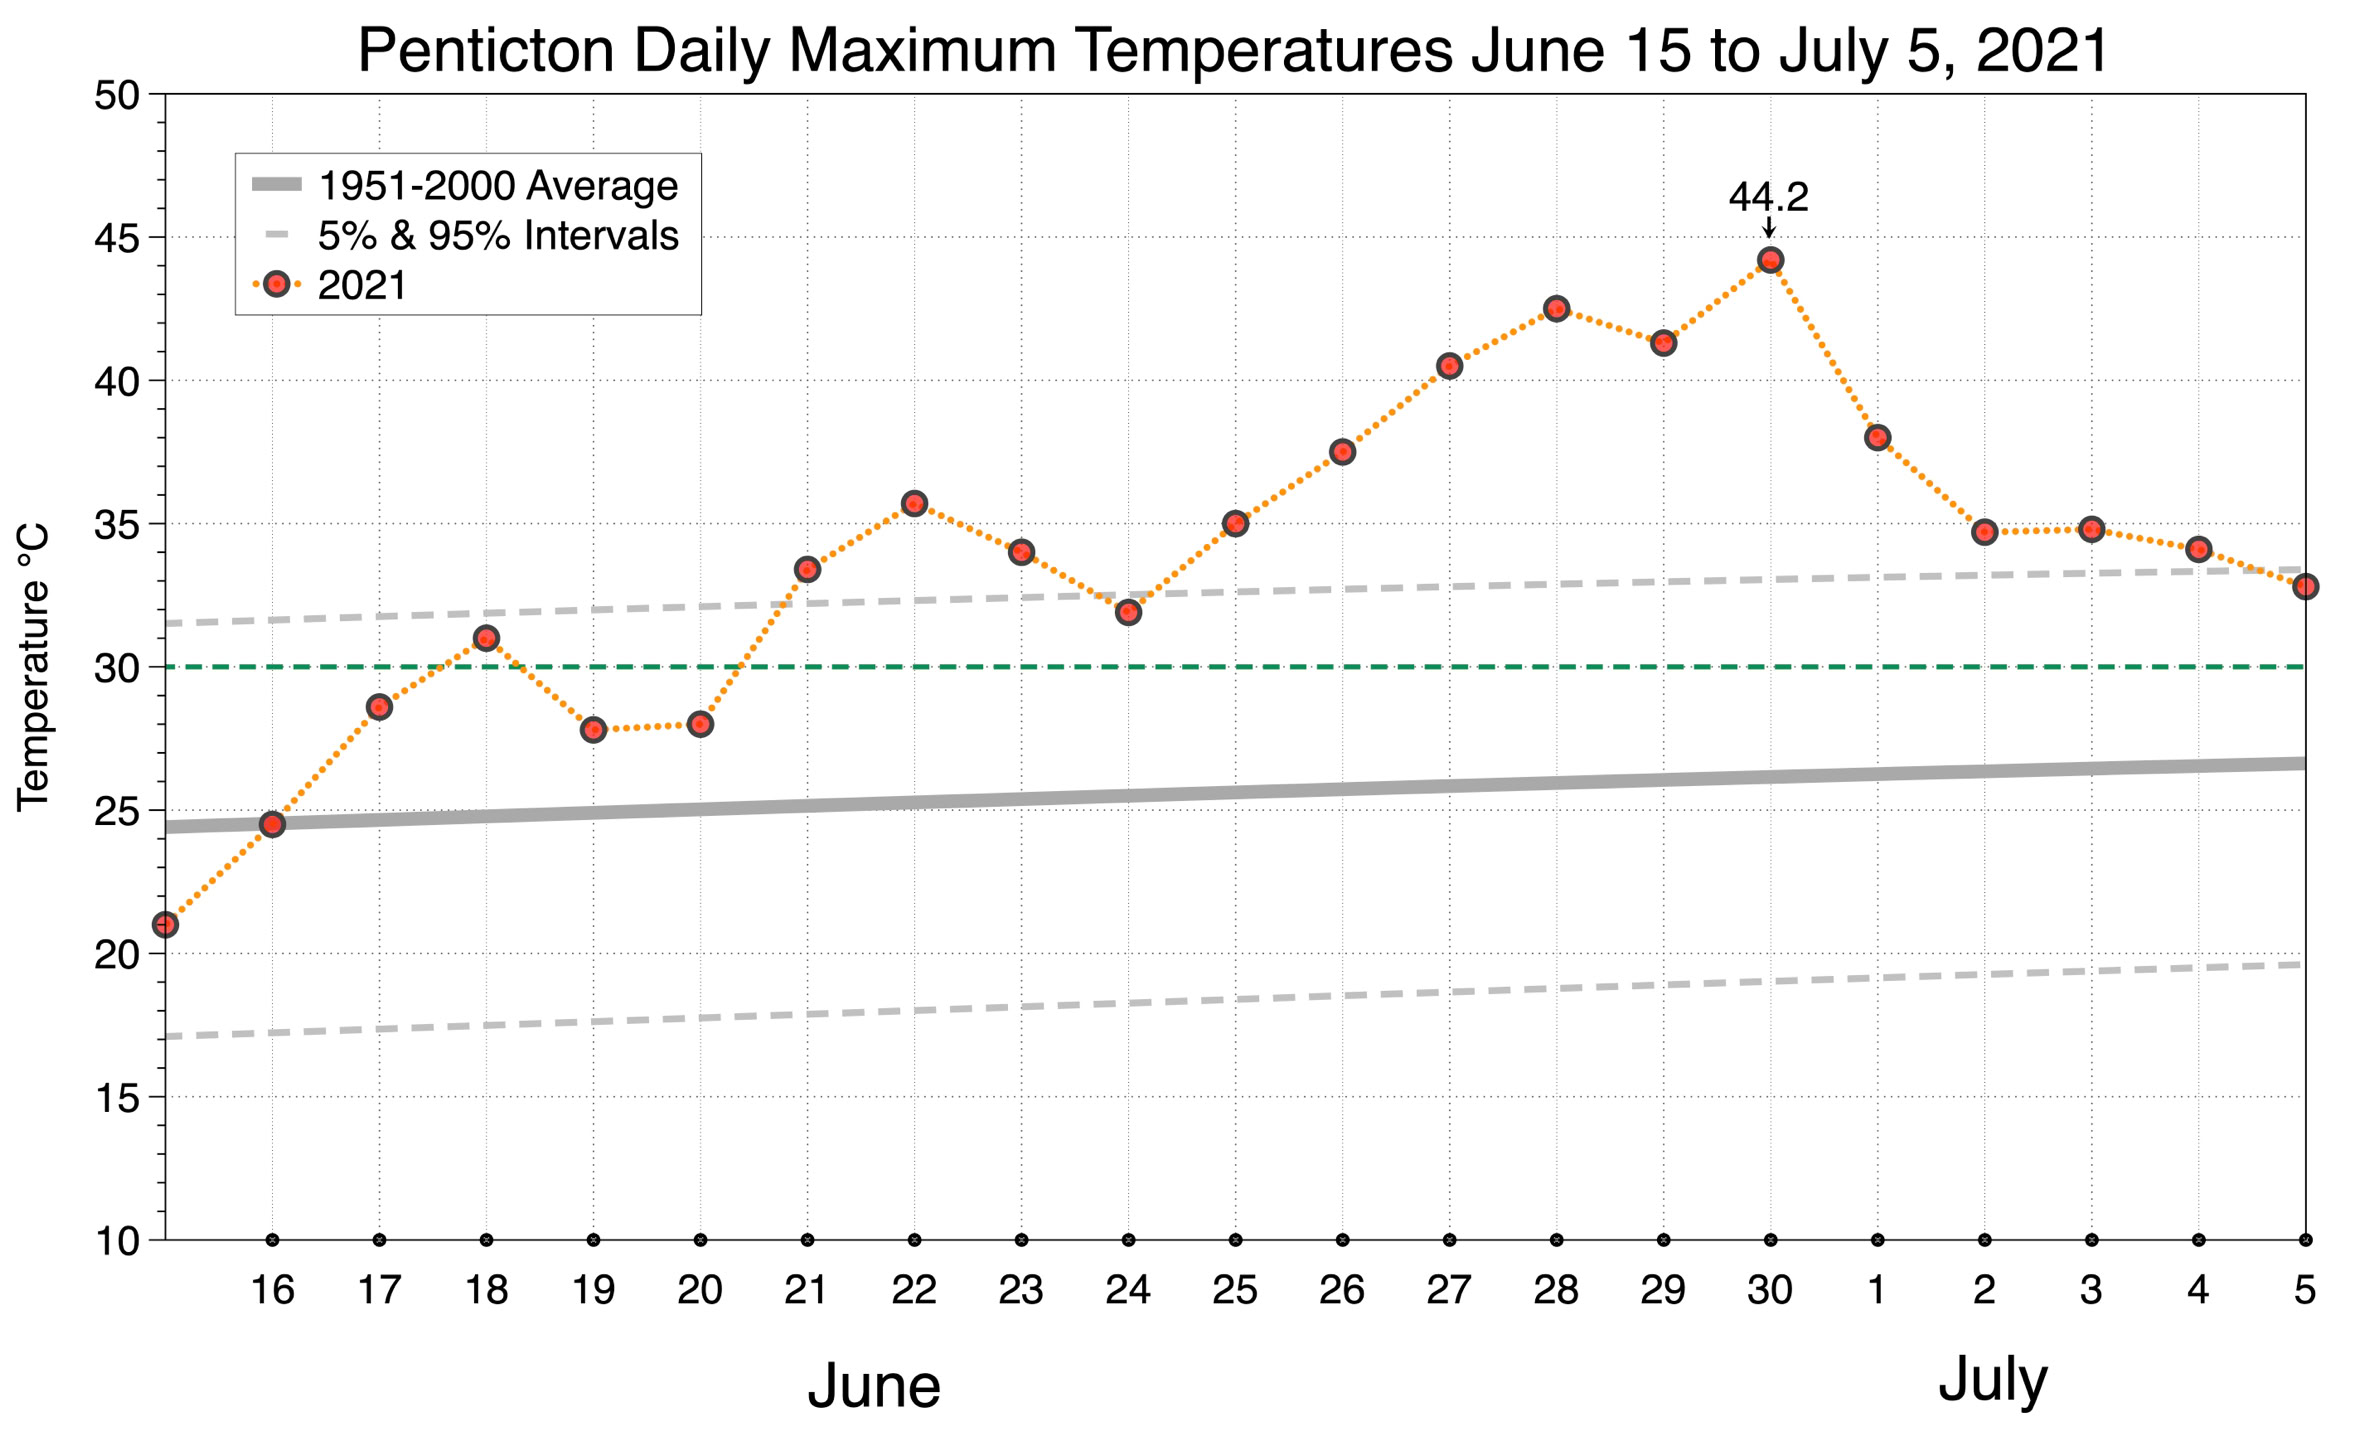
Figure 3 Recorded daily maximum temperatures at Penticton from June 15 to July 5, 2021. Highest recorded temperature occurred on June 30 at 44.2°C. Green dashed line shows the 30°C threshold.
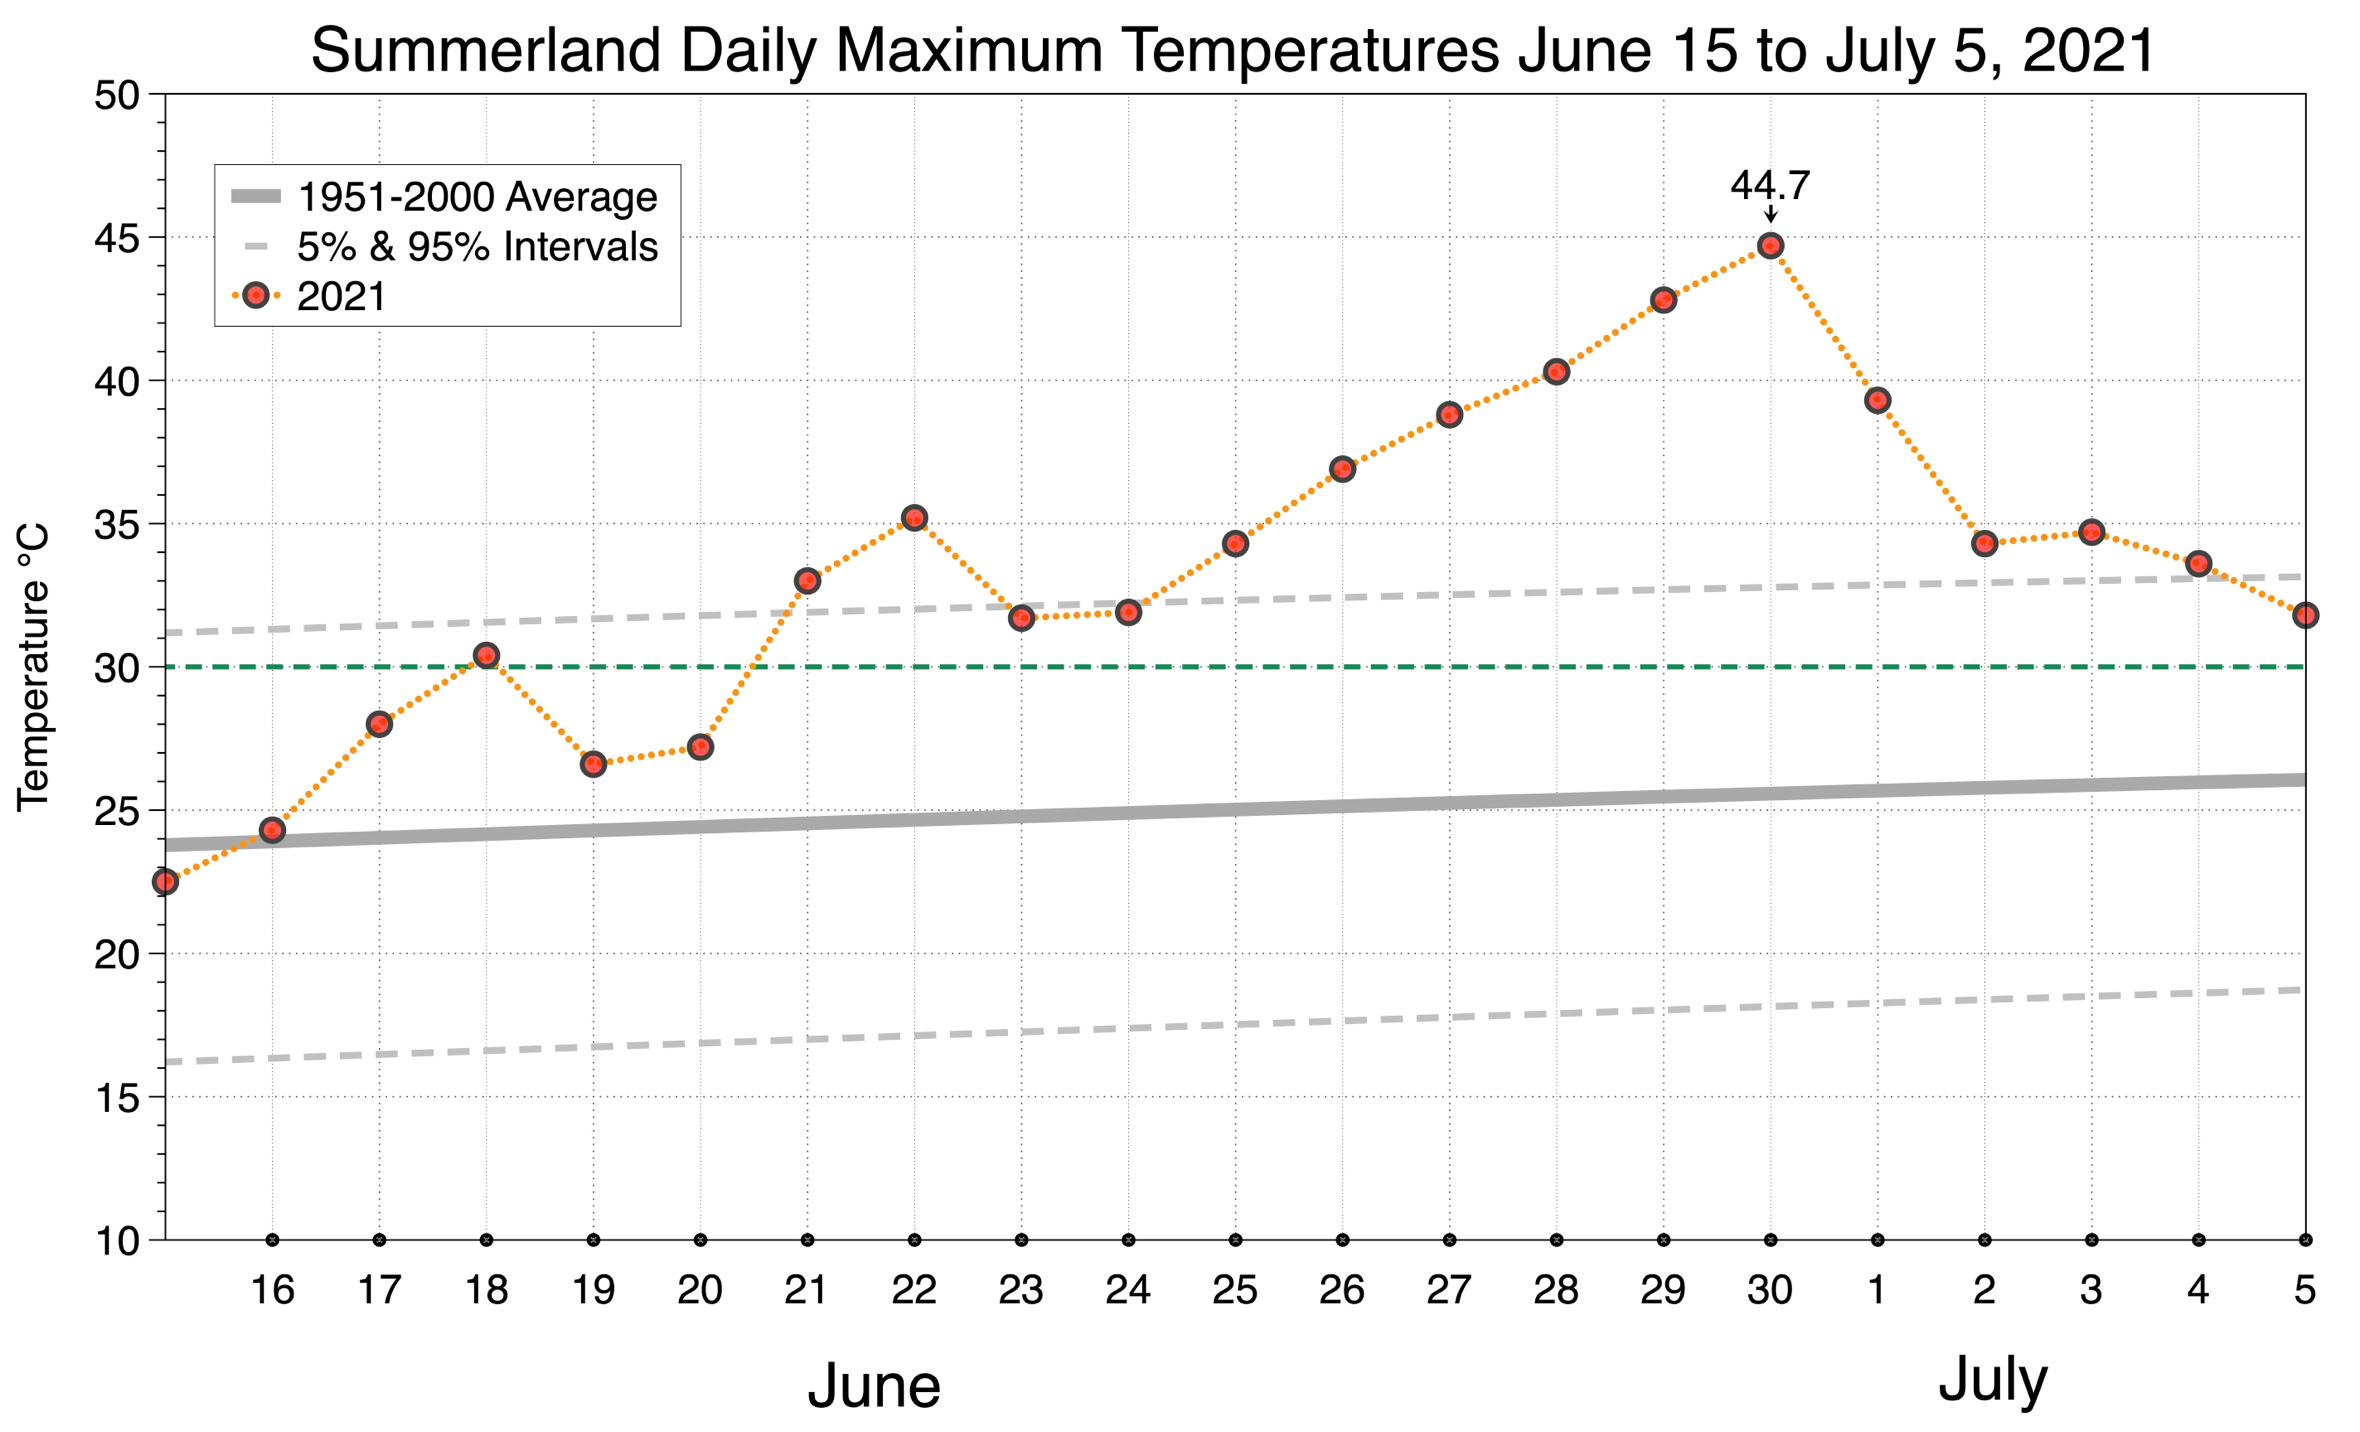
Figure 4 Recorded daily maximum temperatures at Summerland from June 15 to July 5, 2021. Highest recorded temperature occurred on June 30 at 44.7°C. Green dashed line shows the 30°C threshold.
Copyright © 2026 Michael Pidwirny