Summerland - Past Climate
The reconstruction of Summerlands’s climate record from 1951 to today, comes from two weather stations (see map Figure 1):
1) North of the Summerland Ornamental Gardens, station ID 1127800. January 1, 1951 to March 24, 1995.
2) South of the Summerland Ornamental Gardens, station ID 112G8L1. June 1, 1990 to today.
In this analysis, the weather station south of the Summerland Ornamental Gardens was set as the primary station for Summerland. Data from Penticton, adjusted for micro-climatic differences, was used to complete the climate record.
Annual Changes
Displayed in Figure 2 is Kelowna’s annual average mean temperature from 1951 to 2025. Annual average mean temperature is calculated by adding up all of the daily mean temperatures and dividing that value by the number of days in the year (either 365 or 366). Daily mean temperature is calculated by adding the daily maximum temperature and the daily minumum temperature and dividing that value by 2. According to the best-fit line, annual average mean temperature has increased by 1.19°C over the the 75-year record.
Figure 3 shows annual average maximum and minimum temperature from 1951 to 2025. Both temperature measures show a stead increase over the period. Annual average maximum temperatures are increasing at rate of 0.02°C per decade faster than annual average minimum temperatures.
Figure 4 presents the annual precipitation data from 1951 to 2025. Annual precipitation refers to the cumulative amount of rainfall and snowfall that occurred throughout a calendar year. Due to the absence of a substantial number of observations in certain years, those years were excluded from the graph. The average annual precipitation for the remaining years was 306 mm.
Seasonal Changes
Figure 5 shows spring (March, April, and May) average mean temperatures from 1951 to 2025. Over this 75-year period, spring temperatures have increase by 1.23°C.
Figure 6 shows summer (June, July, and August) average mean temperatures from 1951 to 2025. Over this 75-year period, summer temperatures have increase by 1.75°C.
Figure 7 shows fall (September, October, and November) average mean temperatures from 1951 to 2025. Over this 75-year period, fall temperatures have increase by 0.82°C.
Figure 8 shows winter (previous year December, January, and February) average mean temperatures from 1951 to 2025. Over this 75-year period, winter temperatures have increase by 0.93°C.
Monthly Changes
Figure 9 shows the historical change in average monthly minimum temperatures for three periods: 1951 to 1980, 1981 to 2010, and 2011 to 2025. Between 1951 to 1980 and 2011 to 2025, average monthly minimum temperatures rose between 0.16 to 2.55°C in 11 months. The greatest rise in temperature occurred in the January, March, May, July, and August. February saw average monthly maximum temperature declined by 0.71°C between 1951 to 1980 and 2011 to 2025.
Figure 10 displays the historical change in average monthly maximum temperatures for three periods: 1951 to 1980, 1981 to 2010, and 2011 to 2025. Between 1951 to 1980 and 2011 to 2025, average monthly maximum temperatures rose for 10 months between 0.27 to 2.27°C. The greatest rise in temperature occurred in the January, March, May, July, August, and September. December and February saw average monthly maximum temperature declined by 0.08 and 0.58°C, respectively, between 1951 to 1980 and 2011 to 2025.
Days Greater Than 30°C
In Canada, an extreme maximum daily temperature is defined as an event where the temperature exceeds 30°C. Figure 11 illustrates the annual number of extreme maximum daily temperature events that occurred in Summerland from 1951 to 2025. There were approximately 18 such events at the beginning of the temperature record, which increased to around 31 by 2025, marking a significant 72% rise.
Days Less Than 0°C
Figure 12 shows the number of daily minimum temperature events less than (<) 0°C per year from 1951 to 2025. Over this 75-year period, the average annual number of these events has gone from bout 112 in 1951 to 102 in 2025.
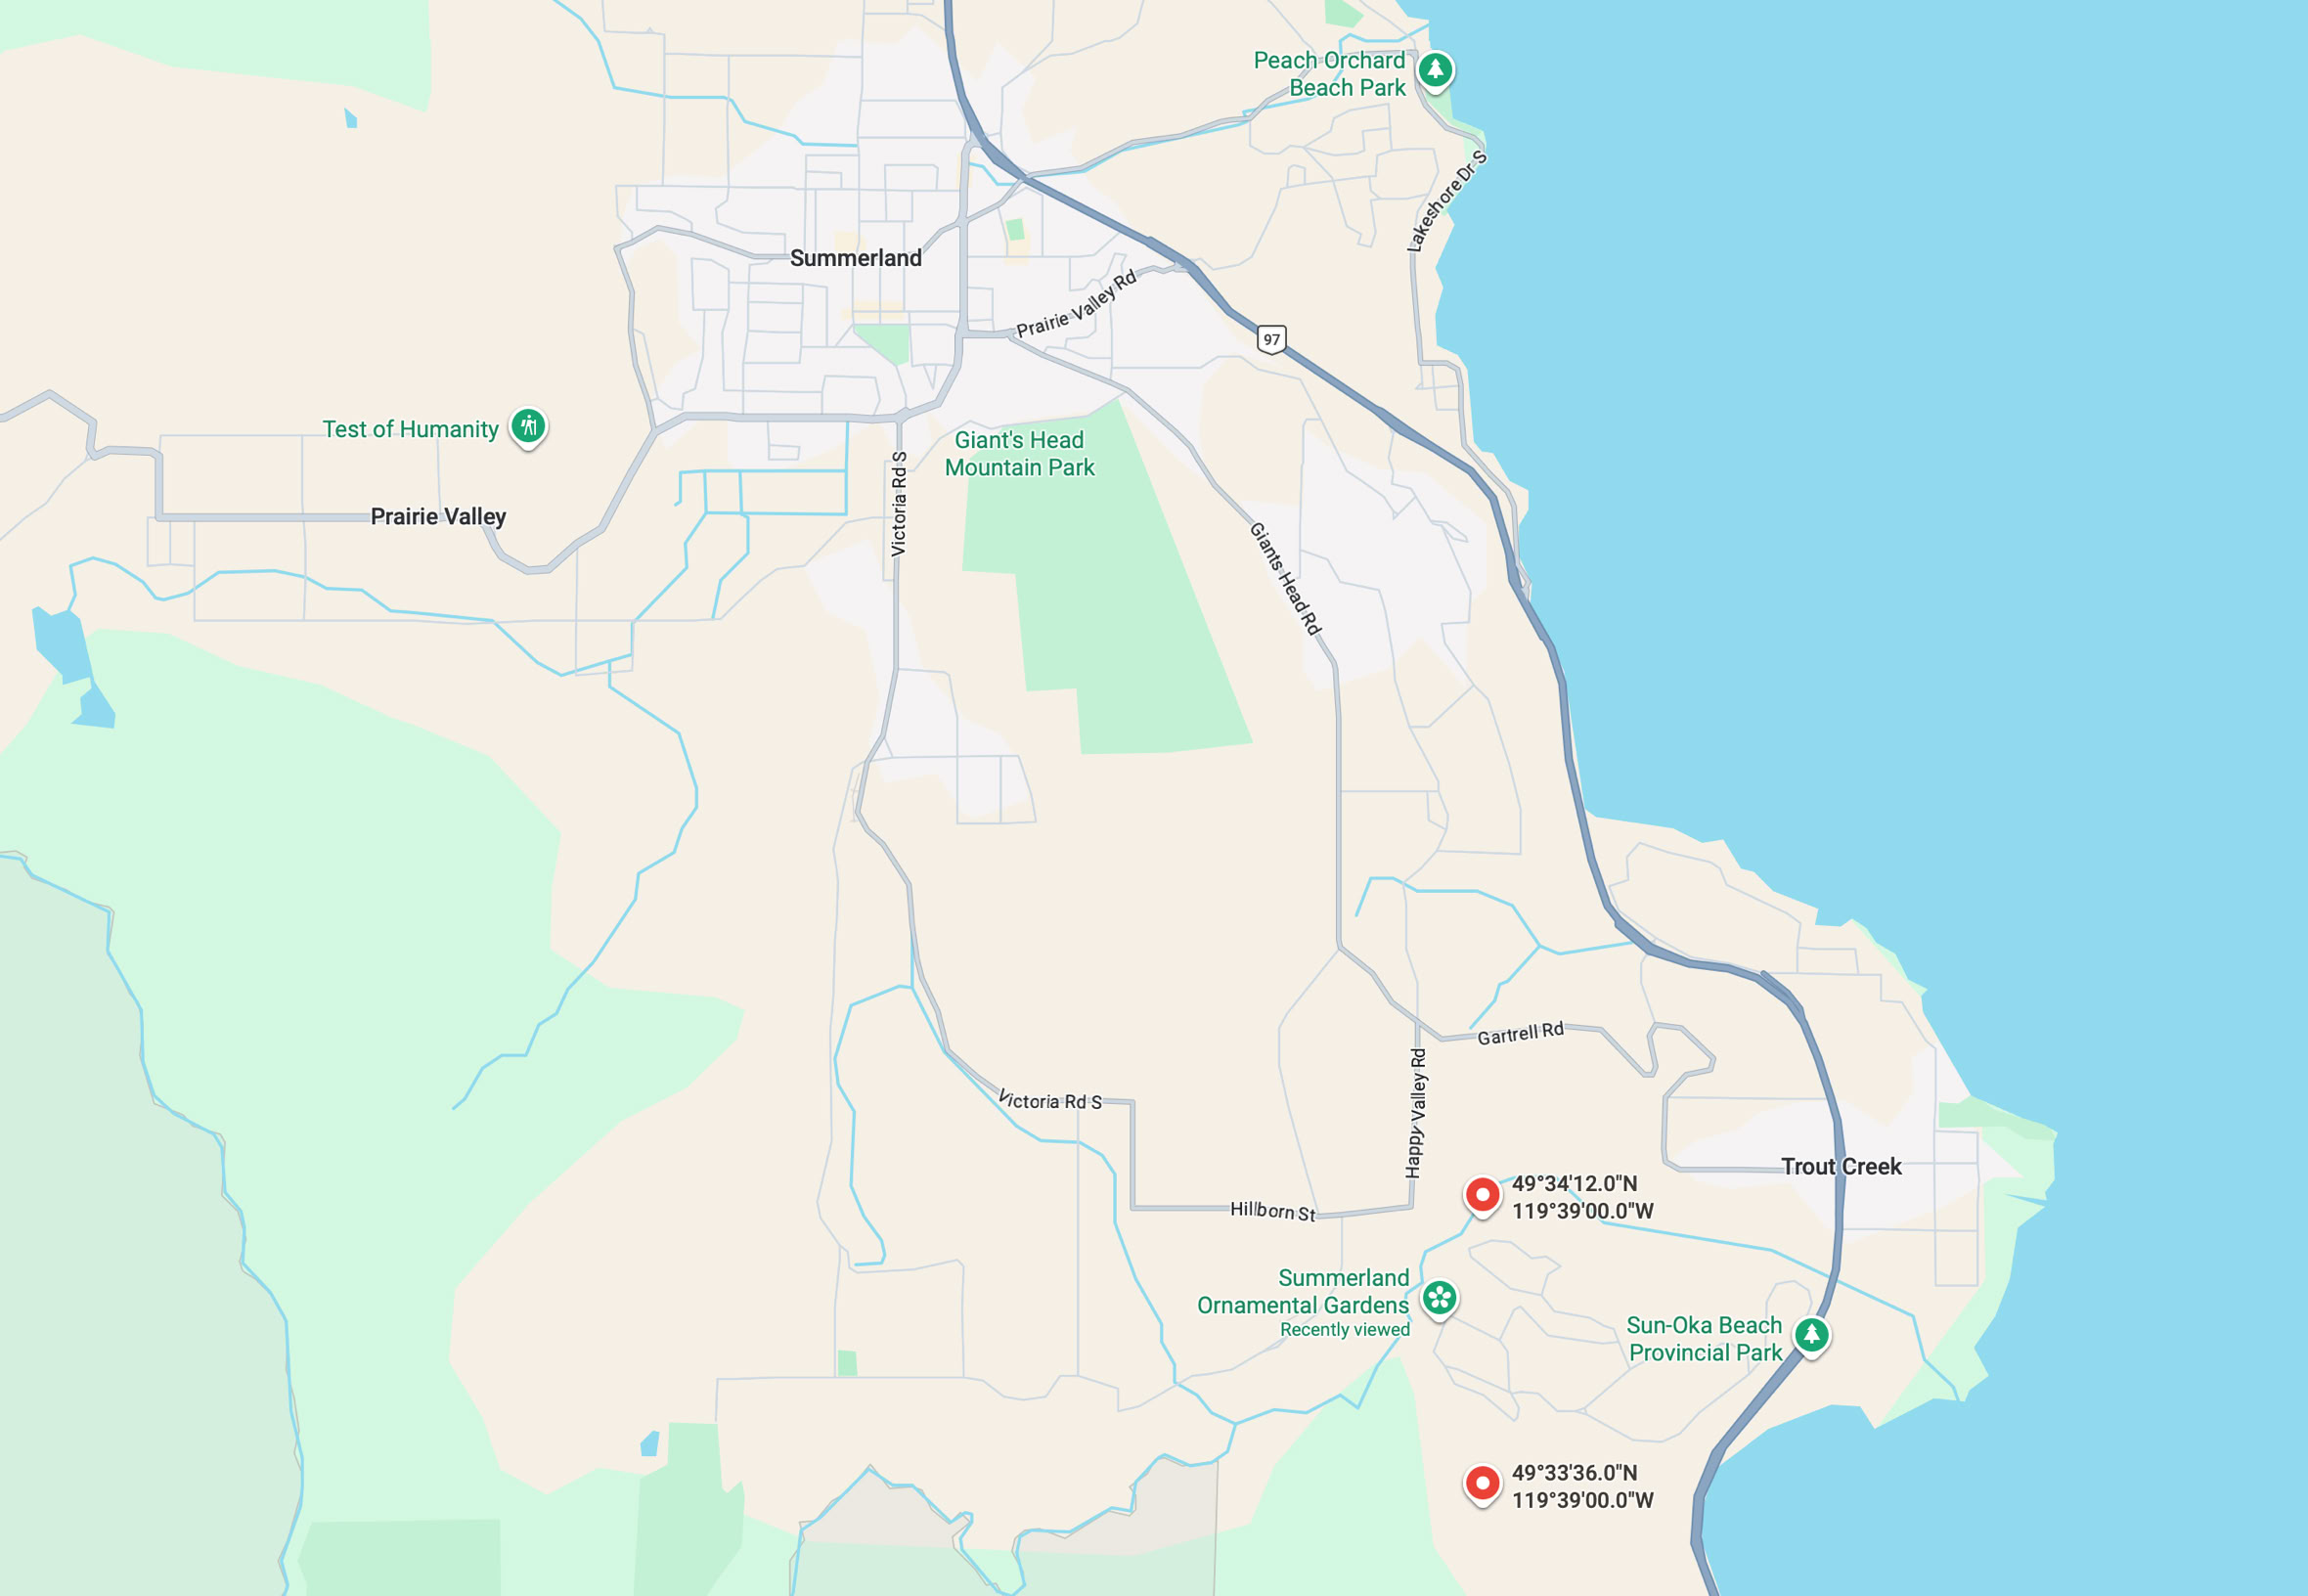
Figure 1 Location of the two weather stations used to reconstruct Summerland’s climate record.
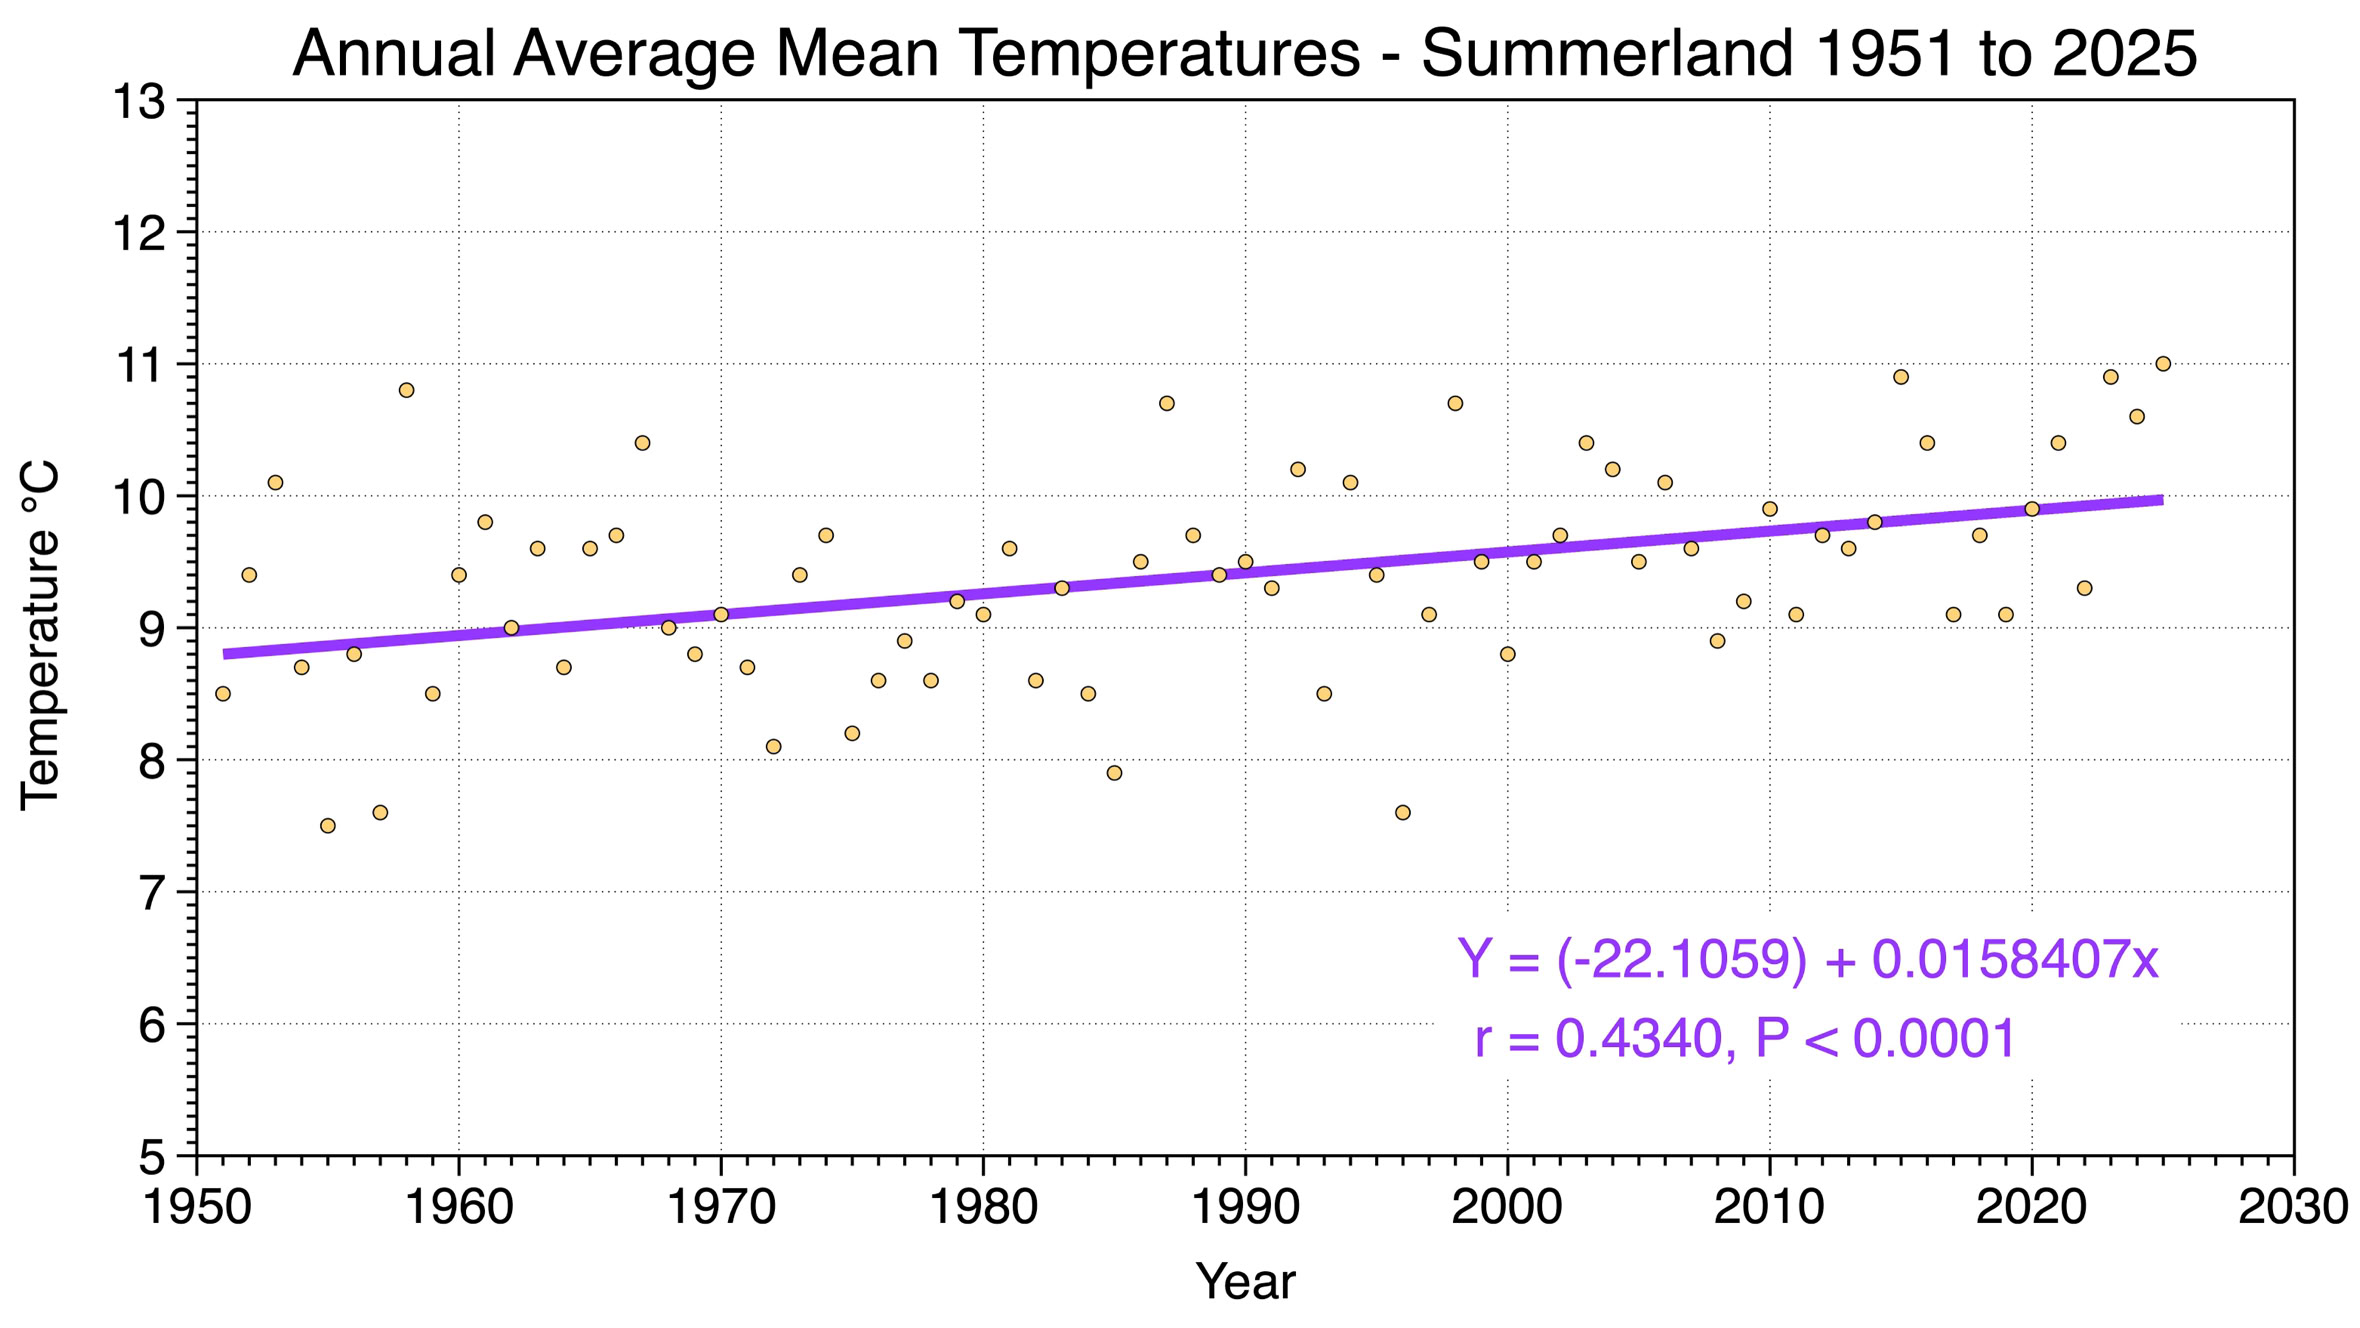
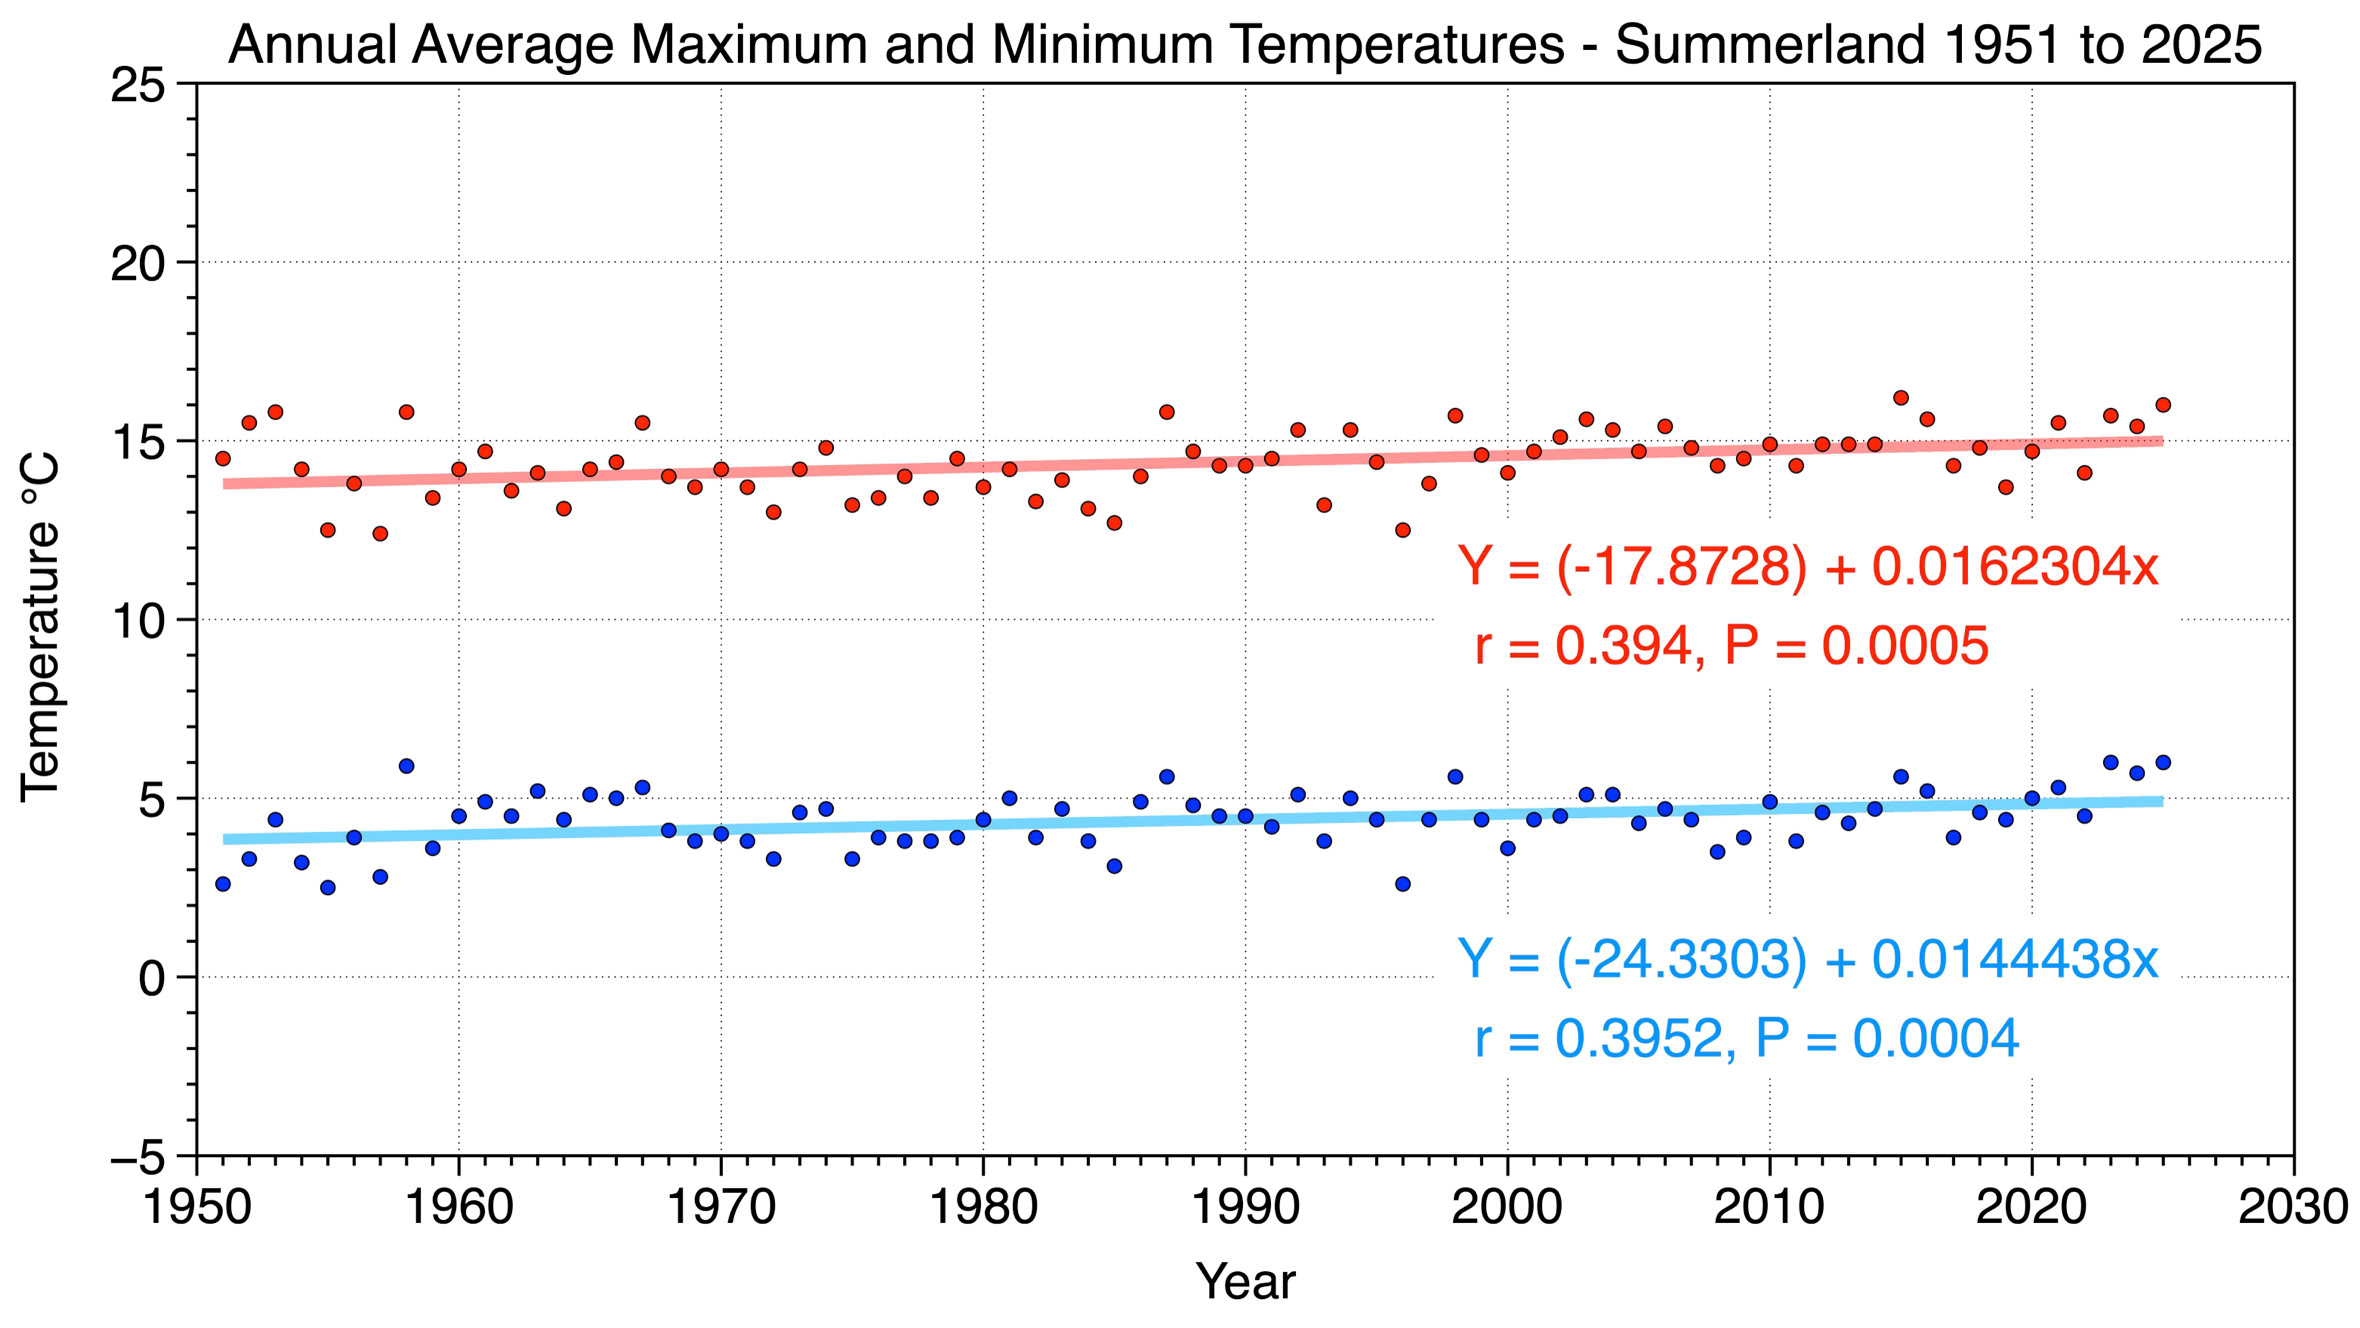
Figure 3 Summerland’s annual average maximum and minimum temperatures from 1951 to 2025. Regression analysis suggests that annual average maximum temperature has been steadily increasing at a rate of 0.16°C per decade, while annual average minimum temperature has been steadily increasing at a rate of 0.14°C per decade.
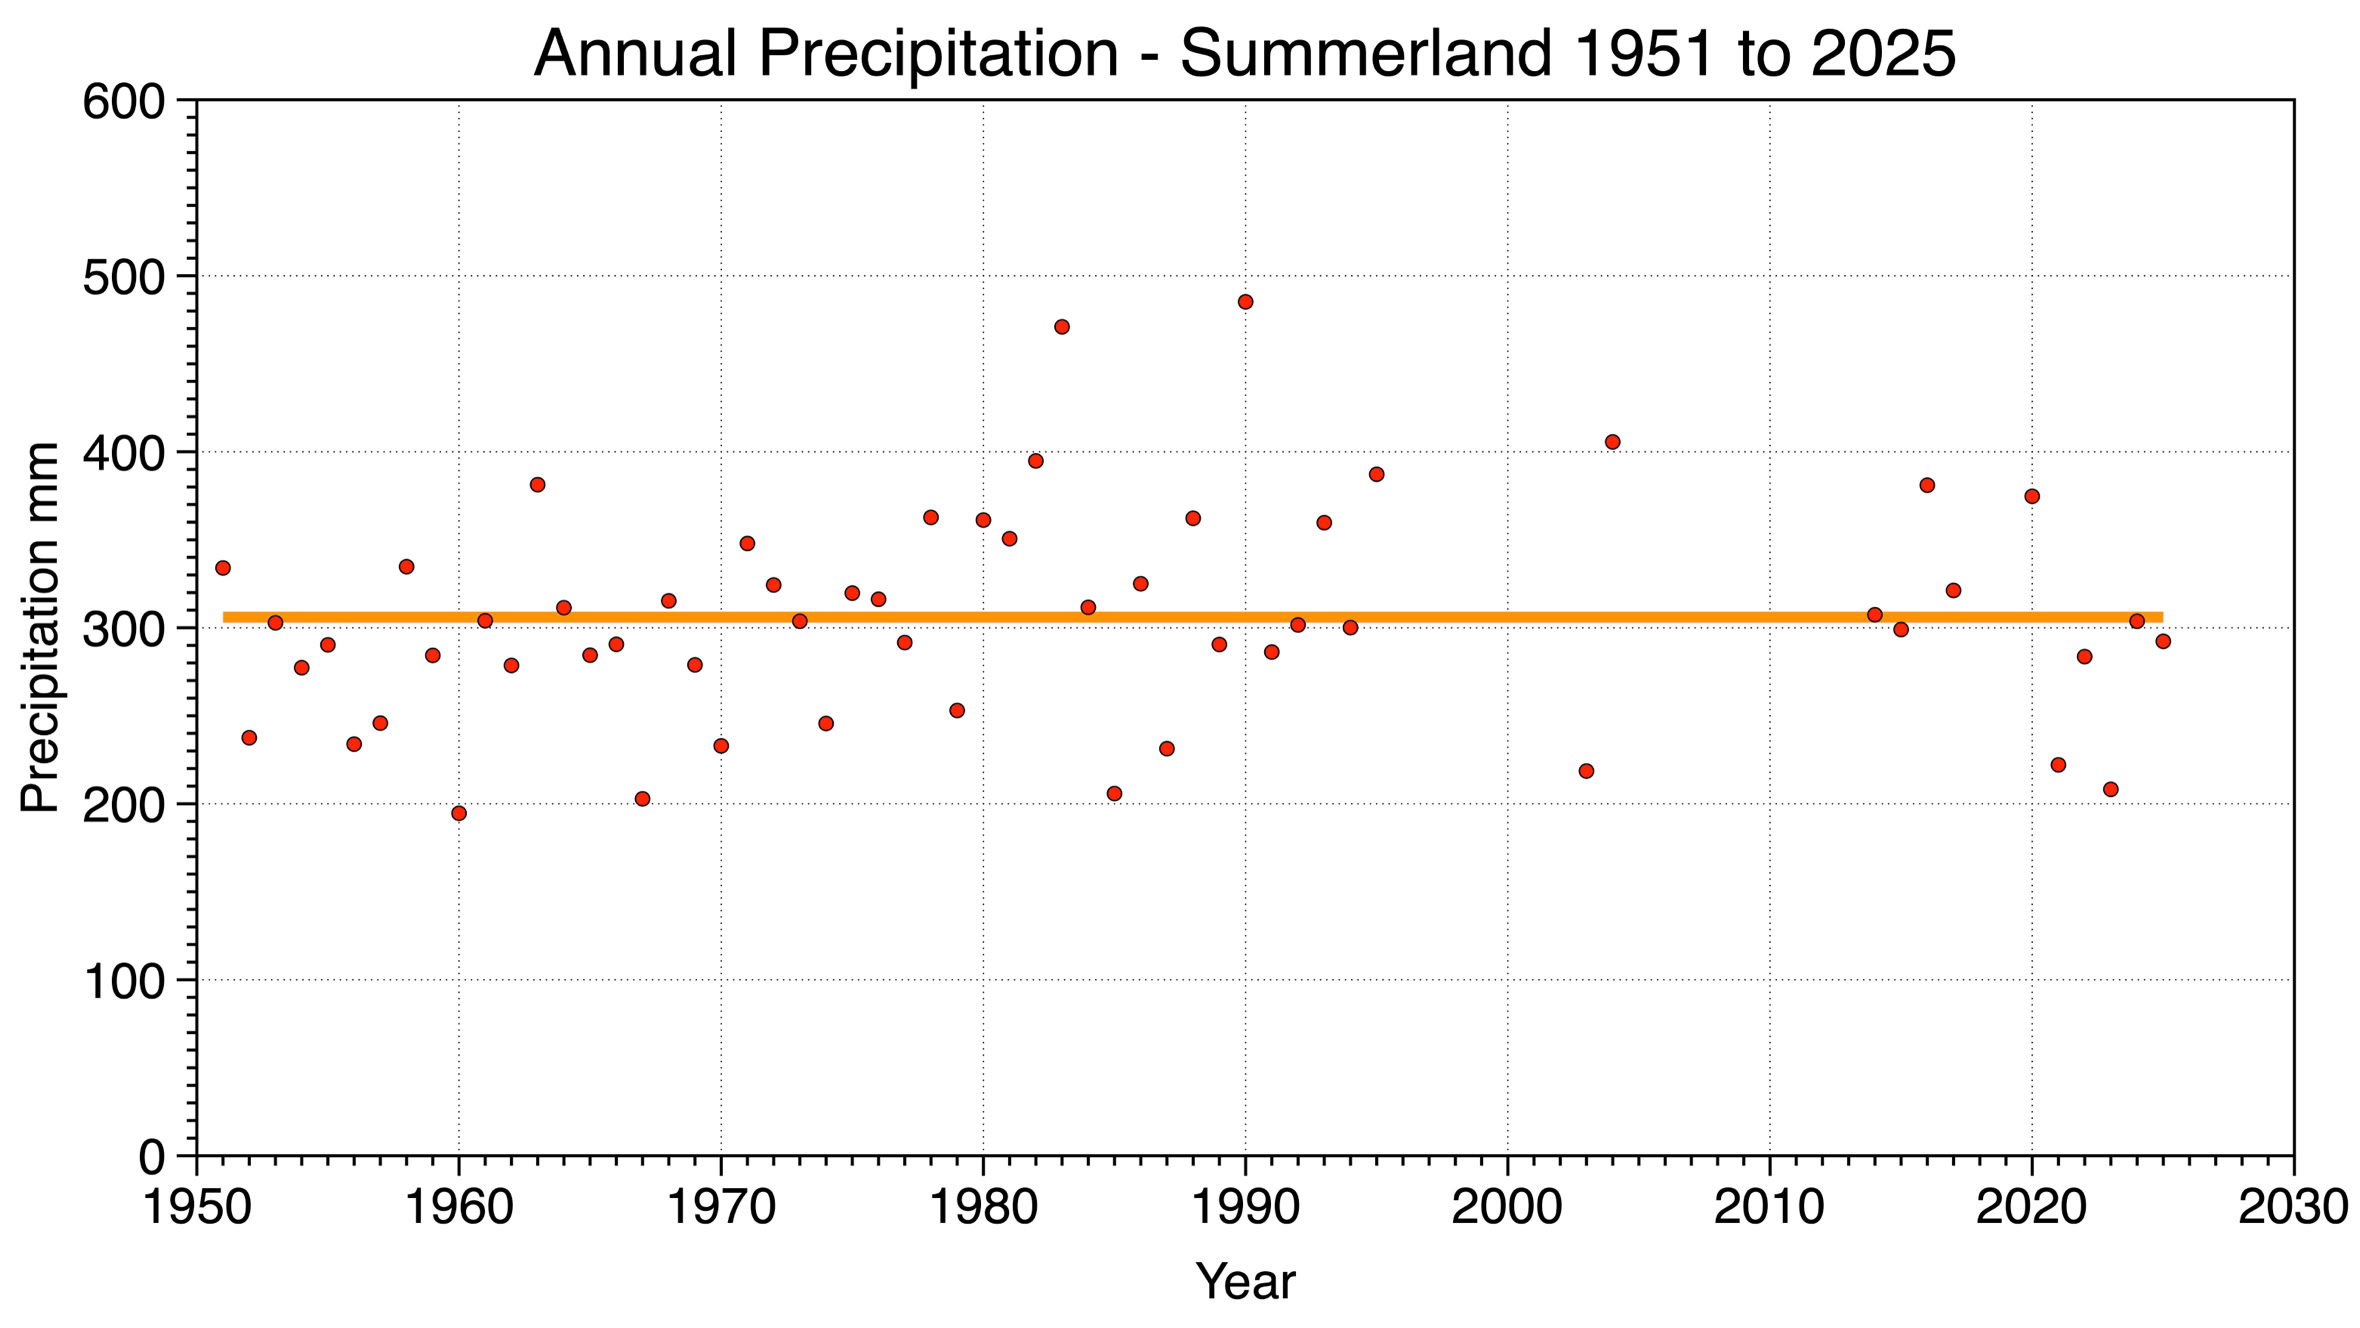
Figure 4 Summerland’s annual precipitation from 1951 to 2025. The orange line shows the average annual precipiation (306 mm) for the years that were plotted.
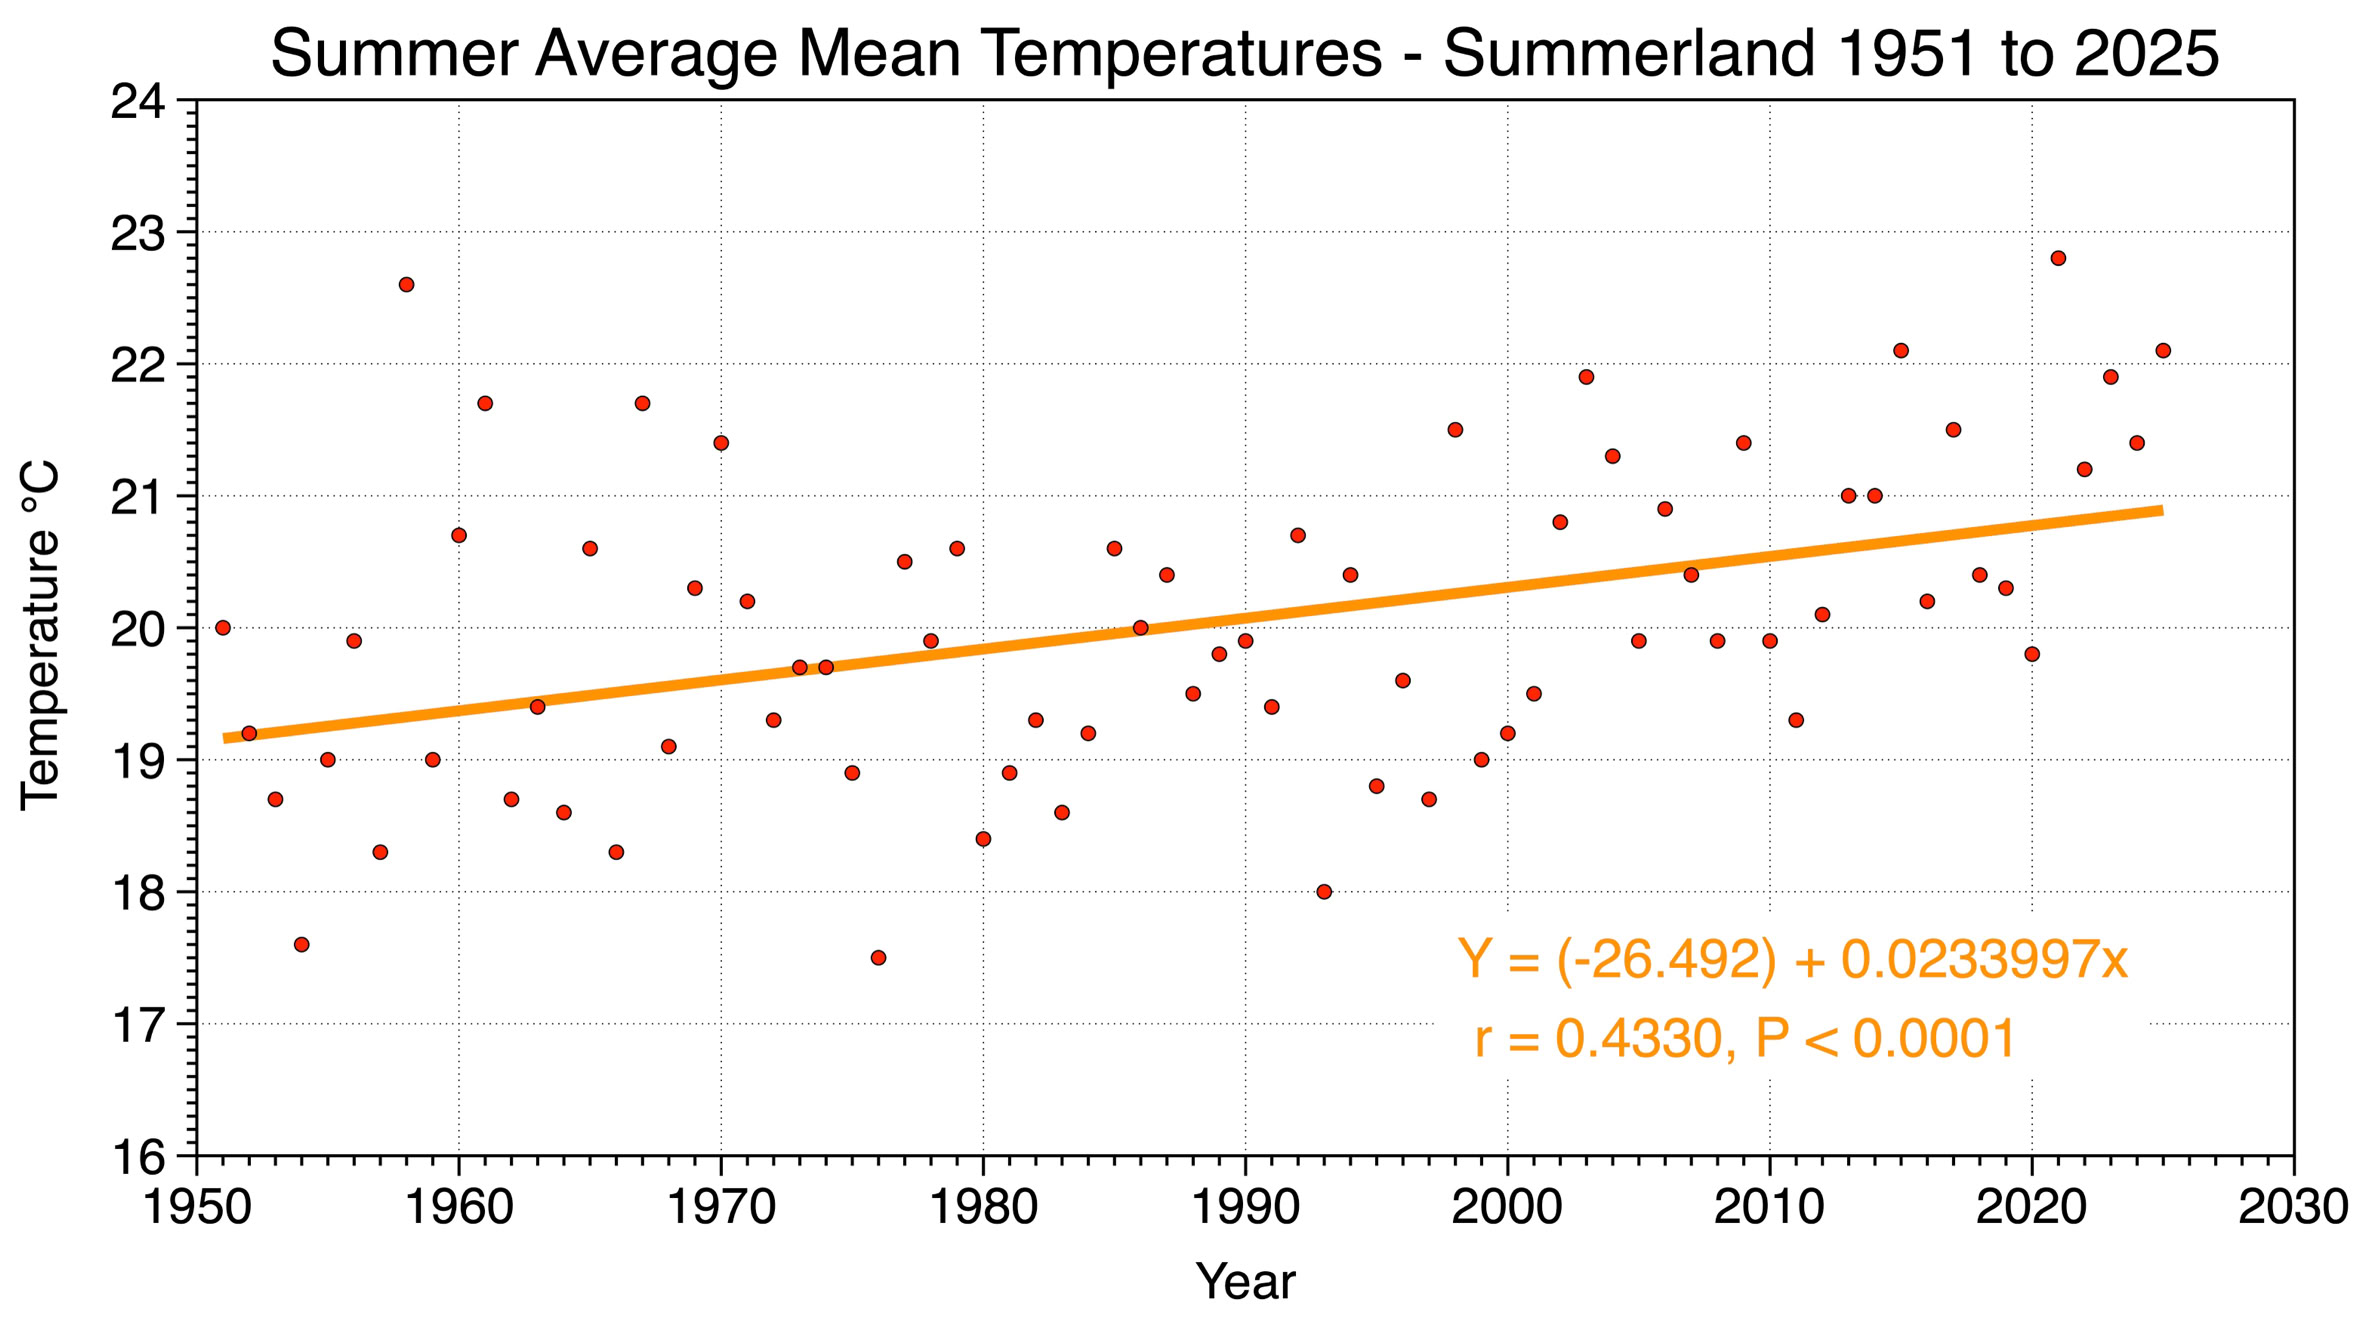
Figure 5 Summerland’s spring average mean temperatures from 1951 to 2025. Spring average mean temperature has been steadily increasing at a rate of 0.16°C per decade according to linear regression analysis.

Figure 6 Summerland’s summer average mean temperatures from 1951 to 2025. Summer average mean temperature has been steadily increasing at a rate of 0.23°C per decade according to linear regression analysis.
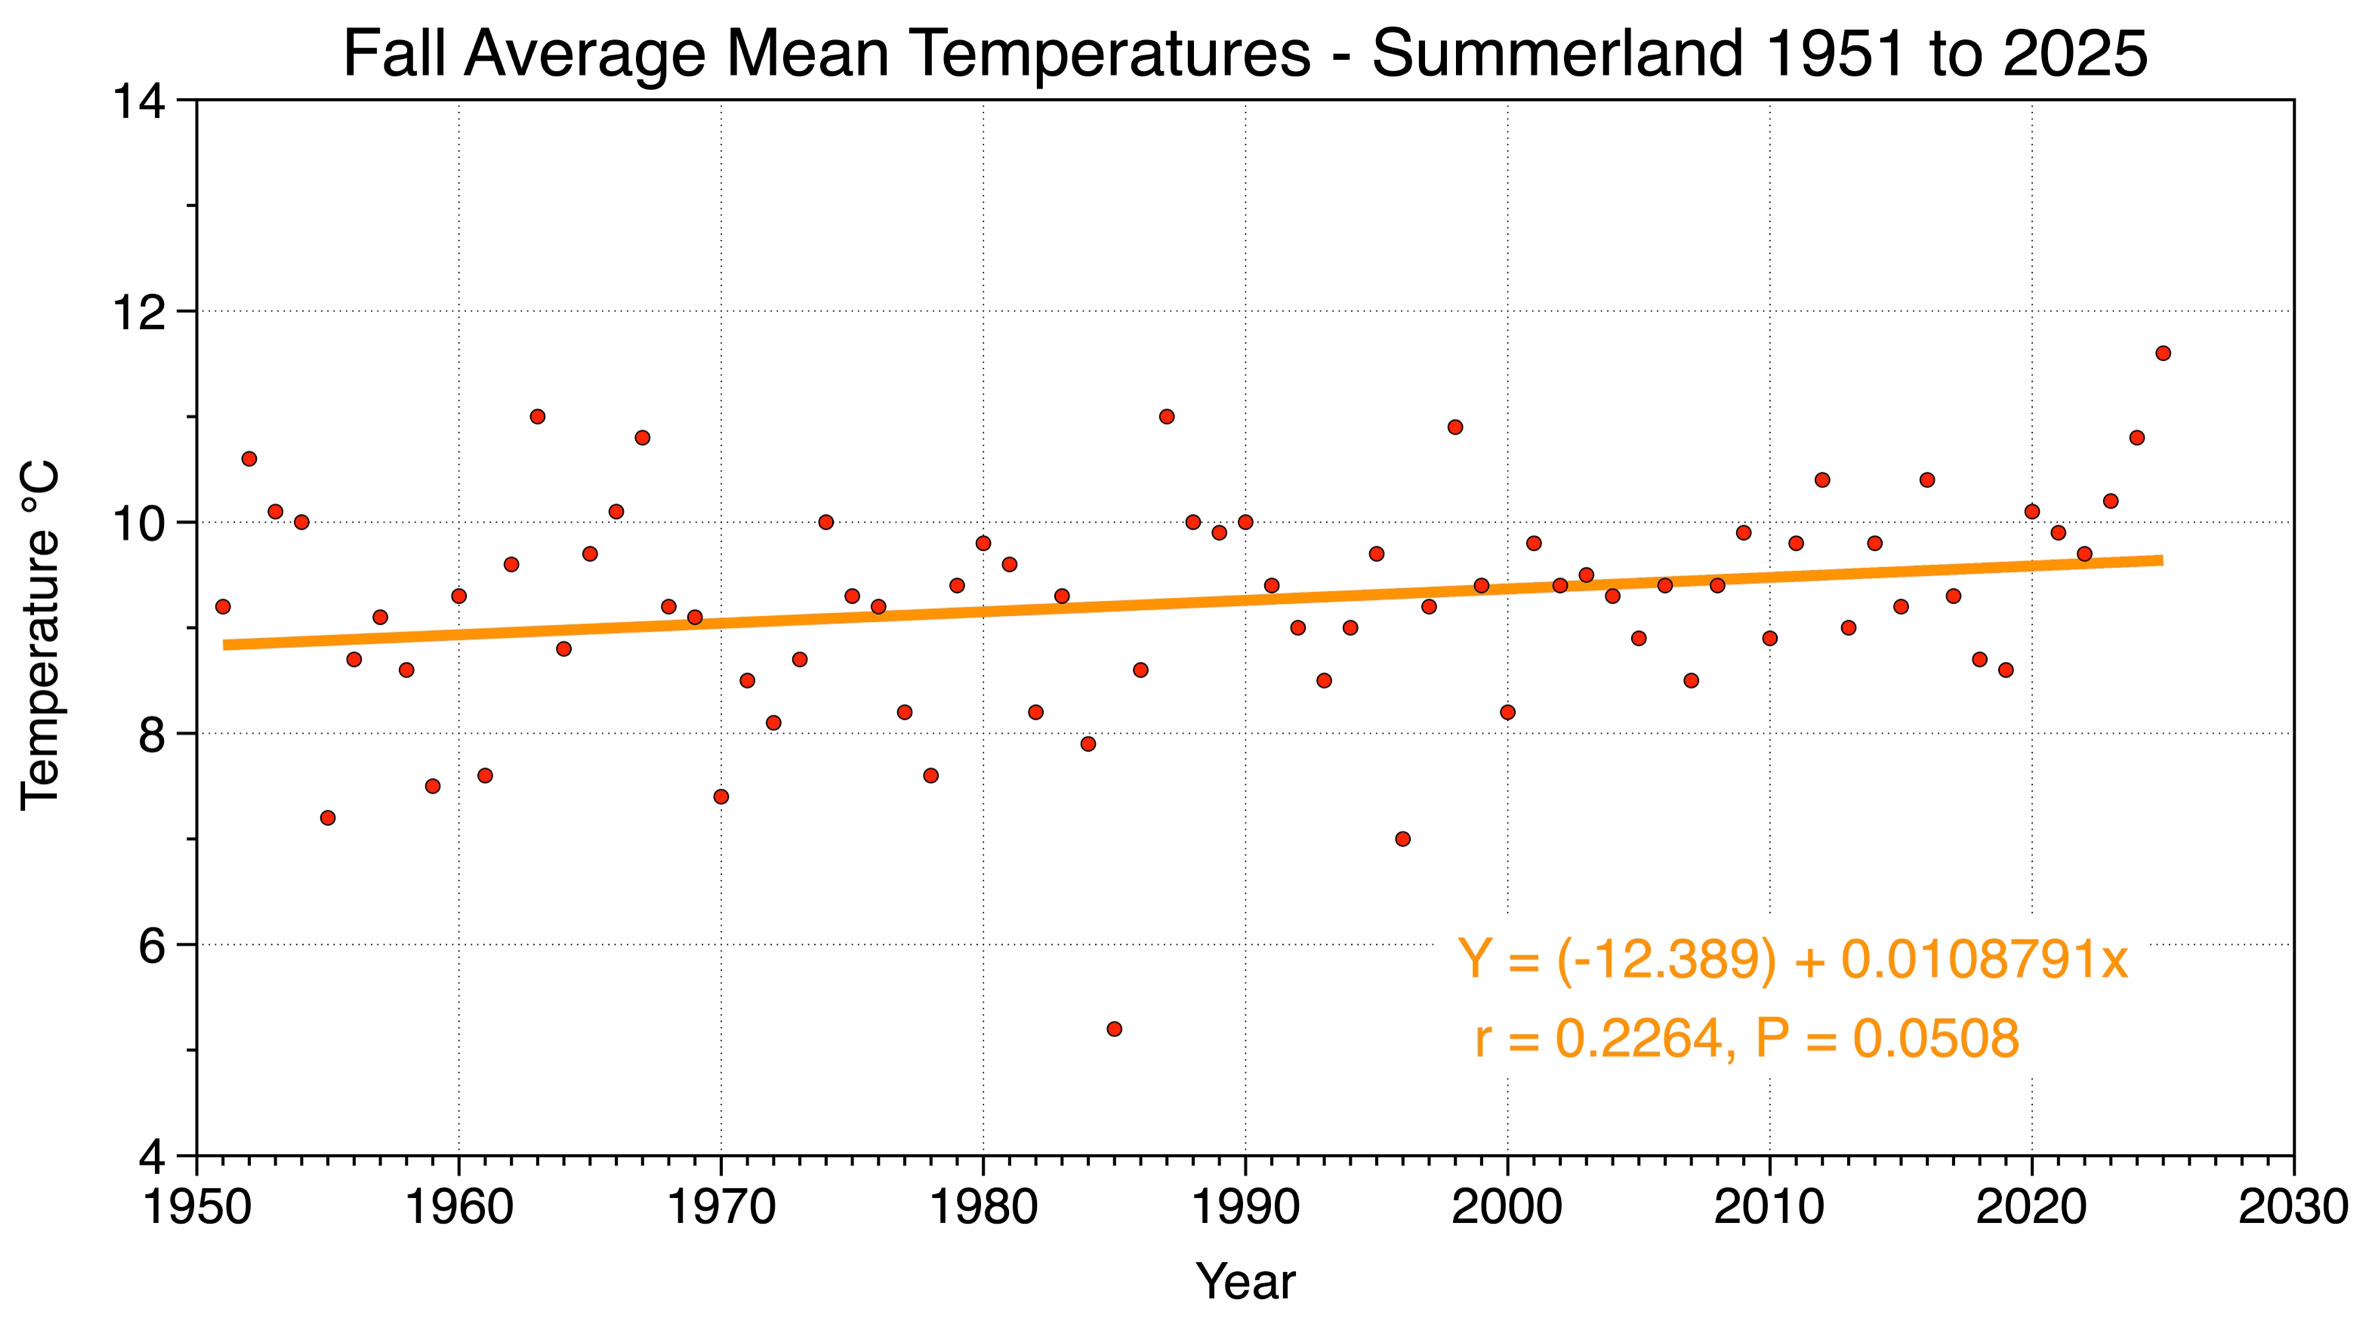
Figure 7 Summerland’s fall average mean temperatures from 1951 to 2025. Fall average mean temperature has been steadily increasing at a rate of 0.11°C per decade according to linear regression analysis.
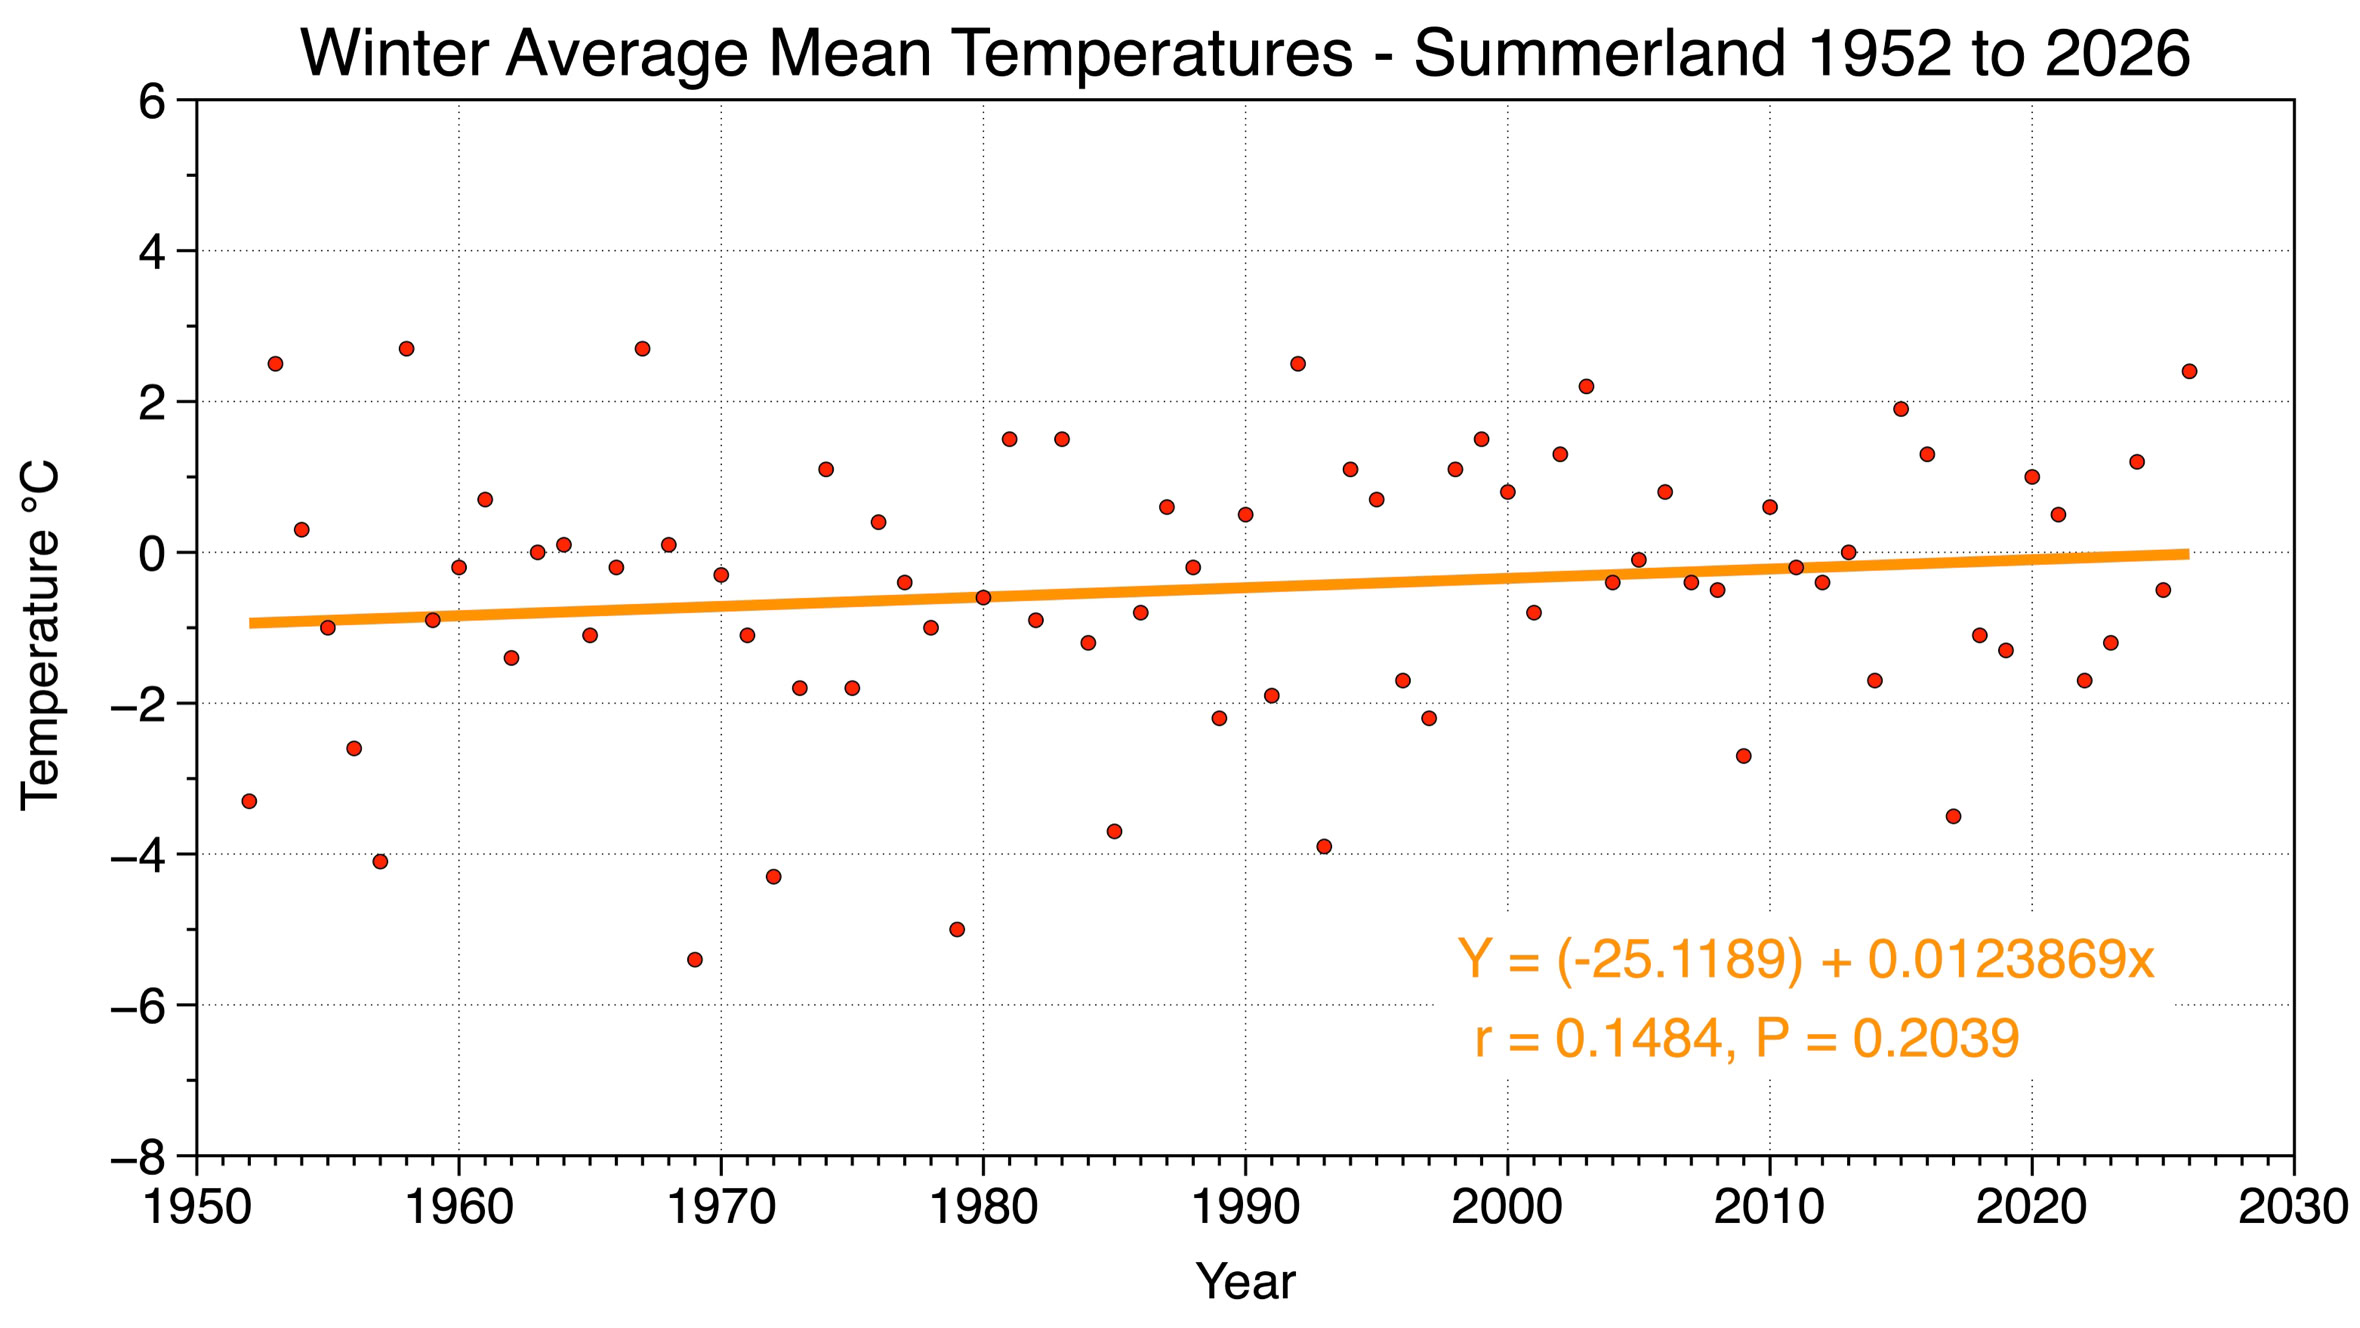
Figure 8 Summerland’s winter average mean temperatures from 1952 to 2026. Winter average mean temperature has been steadily increasing at a rate of 0.12°C per decade according to linear regression analysis.

Figure 9 The historical change in average monthly minimum temperatures for three periods: 1951 to 1980, 1981 to 2010, and 2011 to 2025.

Figure 10 The historical change in average monthly maximum temperatures for three periods: 1951 to 1980, 1981 to 2010, and 2011 to 2025.
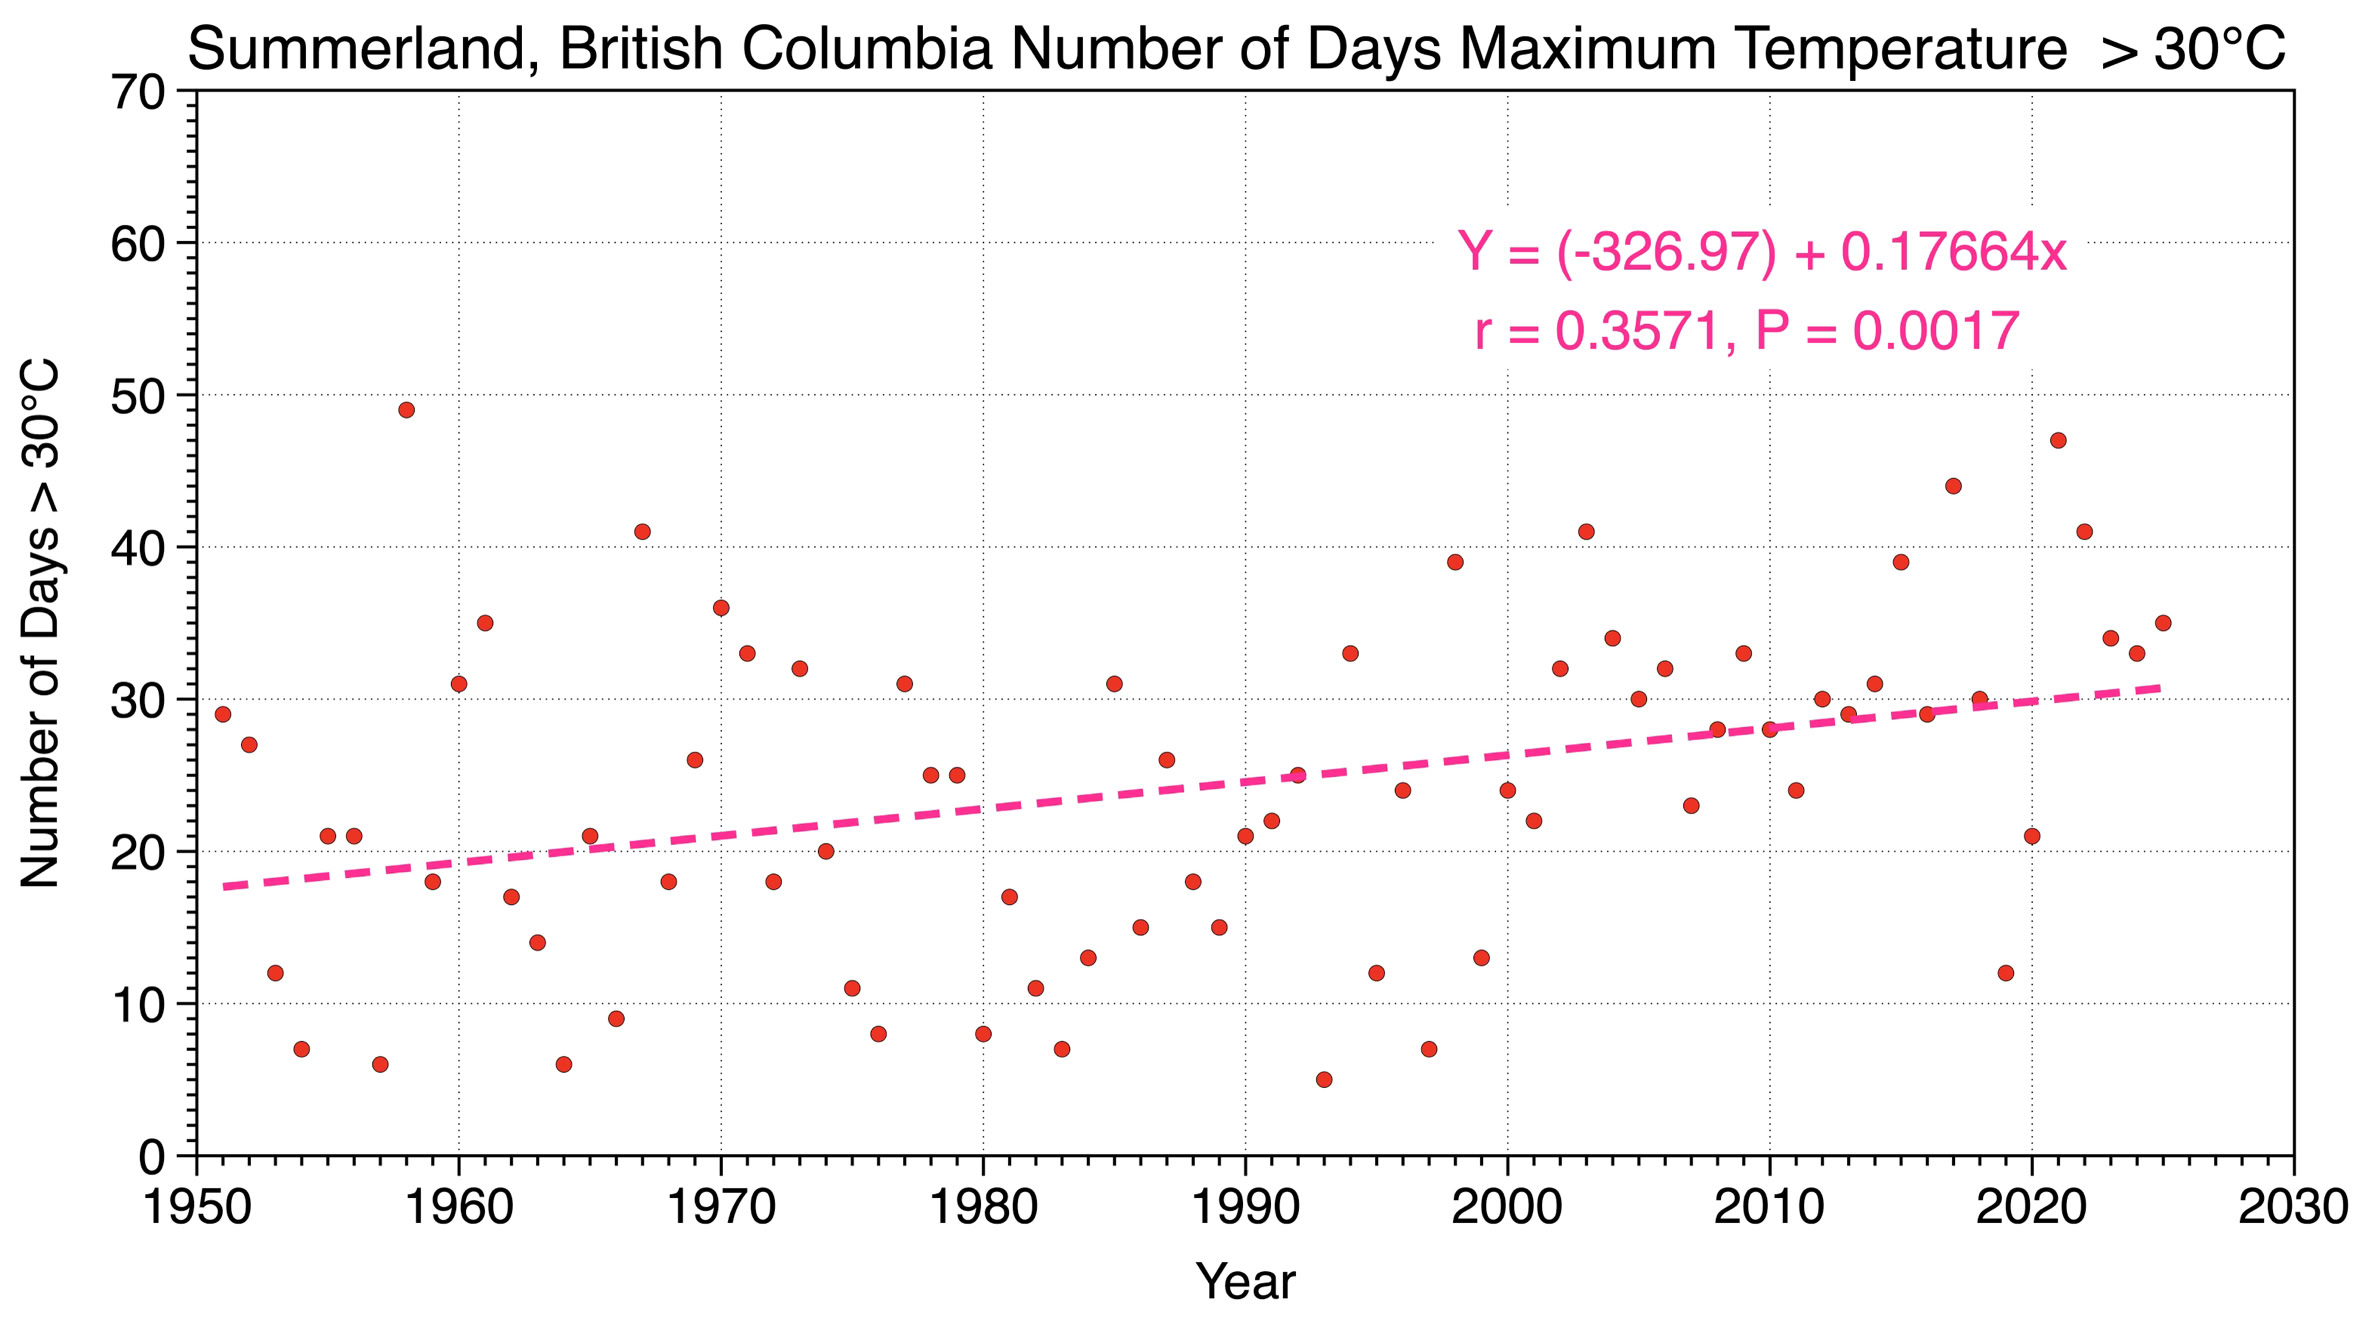
Figure 11 Yearly number of maximum daily temperature events > 30°C from 1951 to 2025 in Summerland. Maximum daily temperature events > 30°C have been steadily increasing at a rate of around 1.8 days per decade according to linear regression analysis.
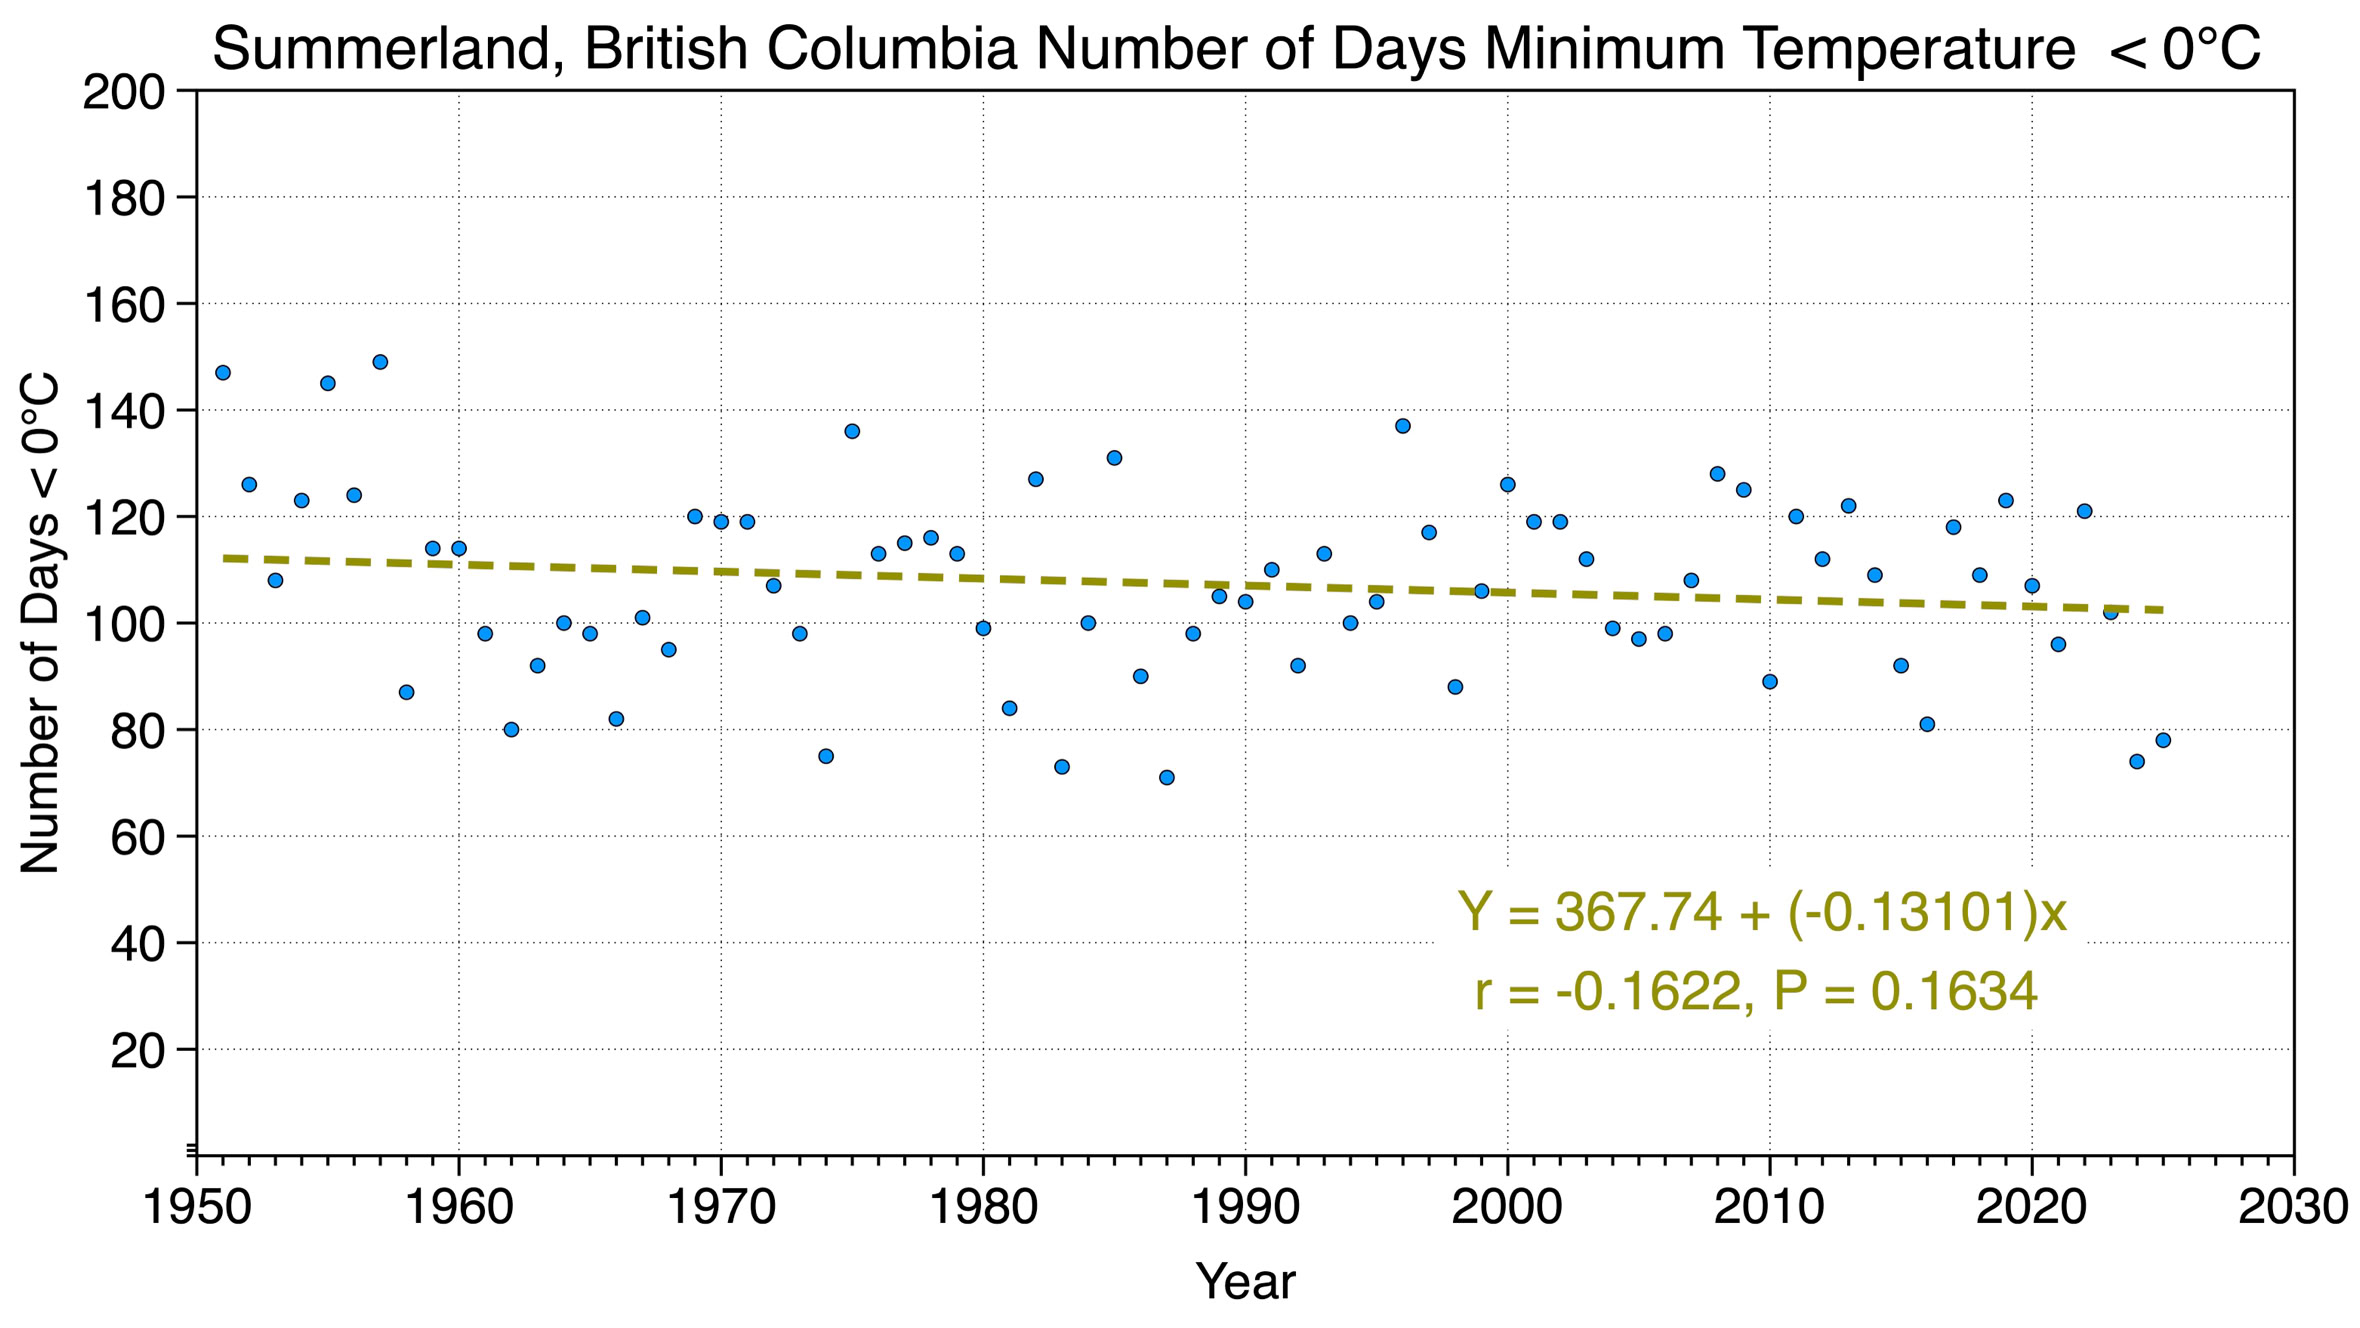
Figure 12 Yearly number of minumum daily temperature events < 0°C from 1951 to 2025 in Summerland. Minimum daily temperature events < 0°C have been steadily decreasing at a rate of about 1.3 days per decade according to linear regression analysis.
Figure 2 Summerland’s annual average mean temperatures from 1951 to 2025. Annual average mean temperature has been steadily increasing at a rate of 0.16°C per decade according to linear regression analysis.
Copyright © 2026 Michael Pidwirny