
Forecasting Human-Caused
Climate Change
Climate scientists often use complex computer models called Global Climate Models (GCMs) to mathematically predict Earth's past and future climate states. When these GCMs are run with higher atmospheric greenhouse gas concentrations, they always predict a warmer global climate. Since the beginning of the 20th century, Earth’s annual mean global temperature has increased by about 1.2 to 1.3°C (2.2 to 2.3°F). Most climate scientists believe this increase, or global warming, may be evidence that the greenhouse effect is being enhanced by higher greenhouse gas concentrations, producing more heat energy and higher Earth temperatures.
The idea of simulating Earth’s weather and climate dynamics using mathematical equations and digital computers emerged shortly after World War II. In 1956, Princeton University’s Norman Phillips made this idea a reality when he successfully ran a highly simplified general circulation model on a computer with just 1 kilobyte of main memory and 2 kilobytes of data storage. Several other researchers improved on Phillips’ pioneering work with more sophisticated numerical methods, better software, and greater computer power. By the beginning of the 1970s, research centers were established in the USA, Germany, Japan, and Britain to facilitate the continued development of General Circulation Models and climate models used in climate change research. The global climate models used in the most recent Intergovernmental Panel on Climate Change 6th Assessment Report are state-of-the-art. These models have many improvements over the software used in the IPCC’s 5th Assessment Reports, released only eight years prior. Despite advances in simulation software and computer hardware, climate change models still have significant room for improvement. Currently, scientists are working on a more realistic simulation of the climatic effects of clouds, atmospheric moisture convection, and the transfer of heat energy between the atmosphere and the oceans.
Within the thousands of lines of computer code, modern global climate models contain many mathematical equations used to represent the various physical processes of fluid motion and energy transfer operating in Earth's atmosphere and/or oceans (Figure 1). However, the quality of these models is only as good as the equations and algorithms used to calculate the simulation output. A three-dimensional cell grid represents the atmosphere and the oceans' horizontal and vertical structures. The many calculations associated with the equations are performed internally in these cells. Then some of the output from the internal calculations is transferred to adjacent cells to simulate cause-and-effect processes that operate across space. Climate models in use today have atmospheric grid cells measuring horizontally on the X and Y axes between 70 and 200 kilometers. Along the vertical axis (Z), about 30 to 40 levels in the atmosphere are represented. Ocean grid cell resolution is approximately 100 x 100 kilometers, with about 30 to 60 vertical layers. Scientists predict that in ten years, the average horizontal grid resolution will be reduced to about 10 x 10 kilometers, producing output with much higher spatial resolution. However, this higher spatial resolution is still too coarse to realistically model smaller-scale climate processes, like the dynamics of individual cloud cells. Ideally, scientists want the highest possible resolution to simulate local-scale climate processes. Simulating the Earth's climate at such a scale will require advances in computing power that are still several decades away.
When evaluating the output of climate change modeling for predictive purposes, it is essential to verify the credibility of the simulated forecast. This credibility testing is often done in two ways. First, climate scientists use the climate model to generate simulations of the past climate, then compare the output to historical data. Such backcasting efforts have suggested that climate change models are reasonably accurate (Hargreaves and Annan, 2014 and IPCC, 2021). Second, compare the forecast produced with actual measurements collected in the future (Frame and Stone, 2013). This type of verification has been performed on the IPCC's first climate change forecast made in 1990 over a 20-year timescale. This first IPCC climate forecast suggested an increase in global mean temperature of 0.7°C to 1.5°C, with the best estimate (average of the 17 simulation models used) of 1.1°C by 2030. Actual measurements indicated that the global mean temperature rose by 0.35°C from 1990 to 2010. Halving the IPCC modeling best estimate yields a 20-year increase of 0.55°C, an overestimate of about 0.20°C relative to the observed increase. However, Frame and Stone (2013) argue that this overestimate could result from the simulation using incorrect inputs for the 20 years, including atmospheric carbon dioxide and methane concentrations that were too high, and from failing to account for the cooling effects of the 1991 Mount Pinatubo volcanic eruption. Rerunning the model with lower carbon dioxide and methane emissions yields a best-estimate warming of 0.37°C over these 20 years. This value is not much different than what occurred, suggesting computer models are accurate globally.
Currently, more than 50 GCMs are used at universities and government research agencies worldwide. The mathematics used in these models is fundamentally based on the same physical laws that operate in the atmosphere. Modeling differences in output between the GCMs arise from the way they handle processes that physical laws cannot explain. For example, some GCMs approximate feedback mechanisms that increase cloud cover development in the atmosphere because of higher evaporation rates under a warmer climate. In these models, increased cloud cover reduces the amount of solar radiation absorbed at the ground surface. Lower absorbed solar radiation leads to less heat generation and a slightly lower annual mean global temperature. Other variables approximated in the various models include aerosol loading, ocean heat transport, surface albedo, and the influence of mountains.
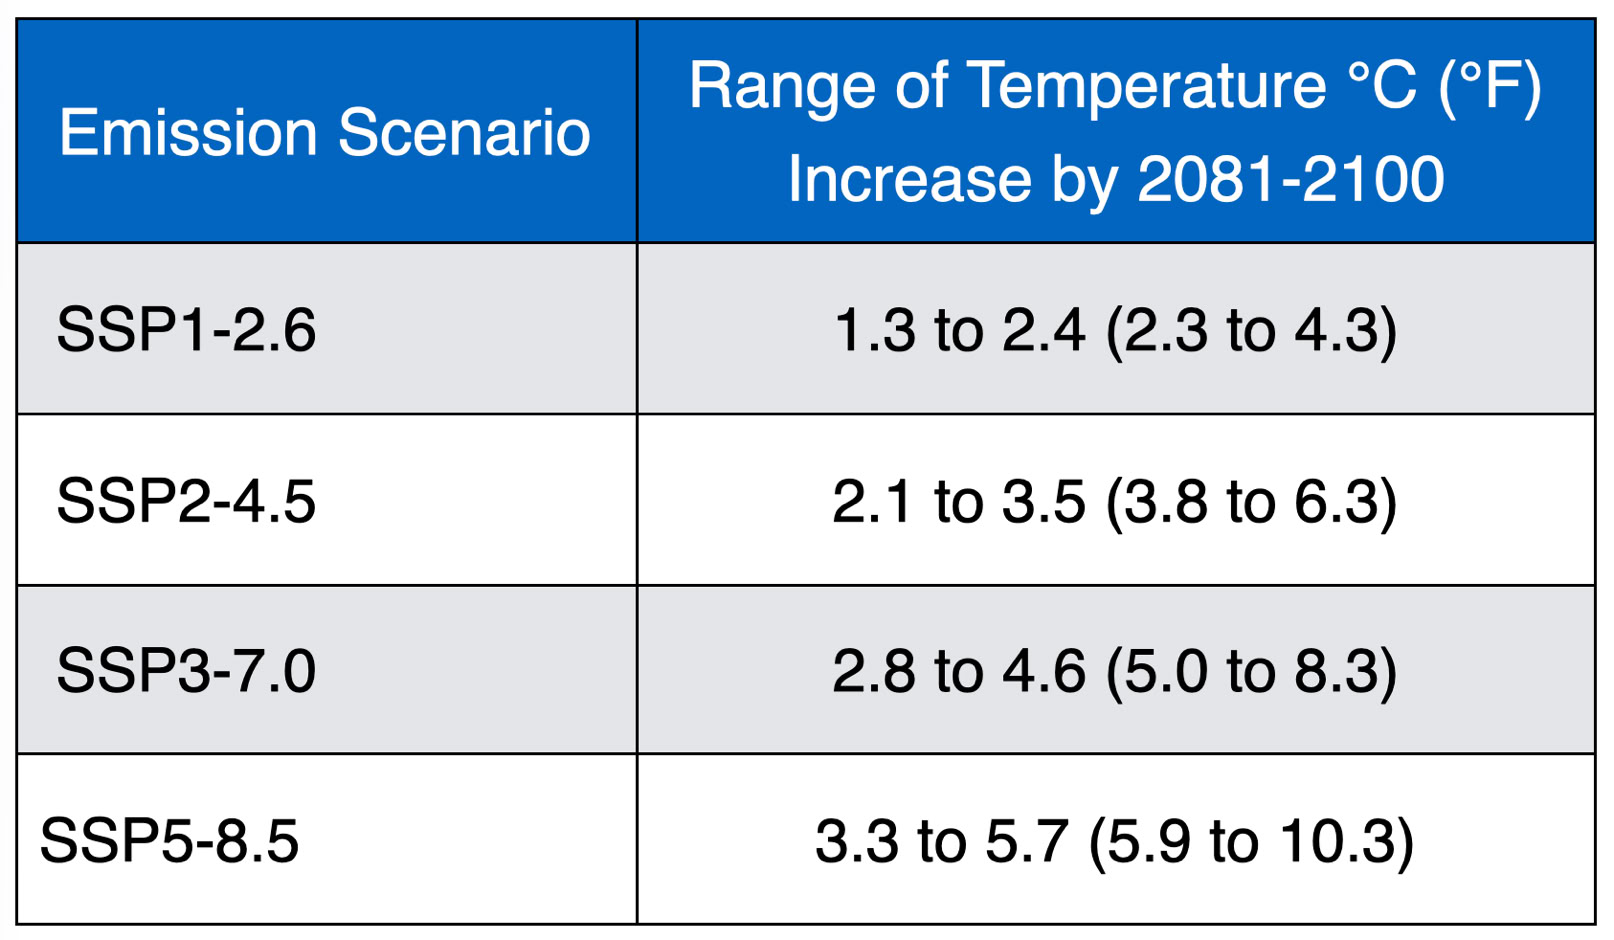
In 2021, the Intergovernmental Panel on Climate Change (IPCC) published the latest results (Sixth Assessment Report, or AR6) of global climate model simulations to forecast various climate outcomes under different reasonable elevated greenhouse gas concentrations. This analysis involved many different computer climate models, each with slightly different ways of approximating how our planet’s climate system operates and producing somewhat different predictions. Variations in computer model output observed in this latest IPCC study suggest that future climate predictions remain not an exact science, despite the computational complexity involved. Despite this minor limitation, the computer model output indicates that Earth’s future global warming will be between 1.3 and 5.7°C (2.3 and 10.3°F) by the end of the 21st century relative to 1986-2005 (Figure 2 and Table 1). For comparison, researchers believe that the much colder surface temperatures at the peak of the last glaciation (15,000 years ago) were caused by a 5°C (9°F) drop in global mean temperature.
References
Frame, David J. and Daithi A. Stone. 2013. Assessment of the first consensus prediction on climate change. Nature Climate Change, 3: 357-359.
Hargraves, J.C. and J.D. Annan. 2014. Can we trust climate models? WIREs Climate Change, 5: 435–440.
IPCC. 2021. Climate Change 2021: The Physical Science Basis. Contribution of Working Group I to the Sixth Assessment Report of the Intergovernmental Panel on Climate Change [Masson-Delmotte, V., P. Zhai, A. Pirani, S.L. Connors, C. Péan, S. Berger, N. Caud, Y. Chen, L. Goldfarb, M.I. Gomis, M. Huang, K. Leitzell, E. Lonnoy, J.B.R. Matthews, T.K. Maycock, T. Waterfield, O. Yelekçi, R. Yu, and B. Zhou (eds.)]. Cambridge University Press, Cambridge, United Kingdom and New York, NY, USA, 2391 pp.

Figure 1 Climate models consist of many differential equations that describe the physical and chemical processes operating in the atmosphere to create weather and climate. These equations operate within a three-dimensional grid that extends from the Earth's surface into the atmosphere, where weather occurs, and from the surface of our planet's oceans, deep within these water bodies. When the computer simulation model is run with the entered inputs, numerous calculations are performed within and between the cells of the grid. These calculations can take days to weeks to months to complete, depending on the model's complexity and the computer's power. Upon completing these calculations, the output is produced in the form of wind speed, wind direction, atmospheric pressure, air temperature, ocean temperature, and so on, within the various cells of the model. Image Copyright: Michael Pidwirny.
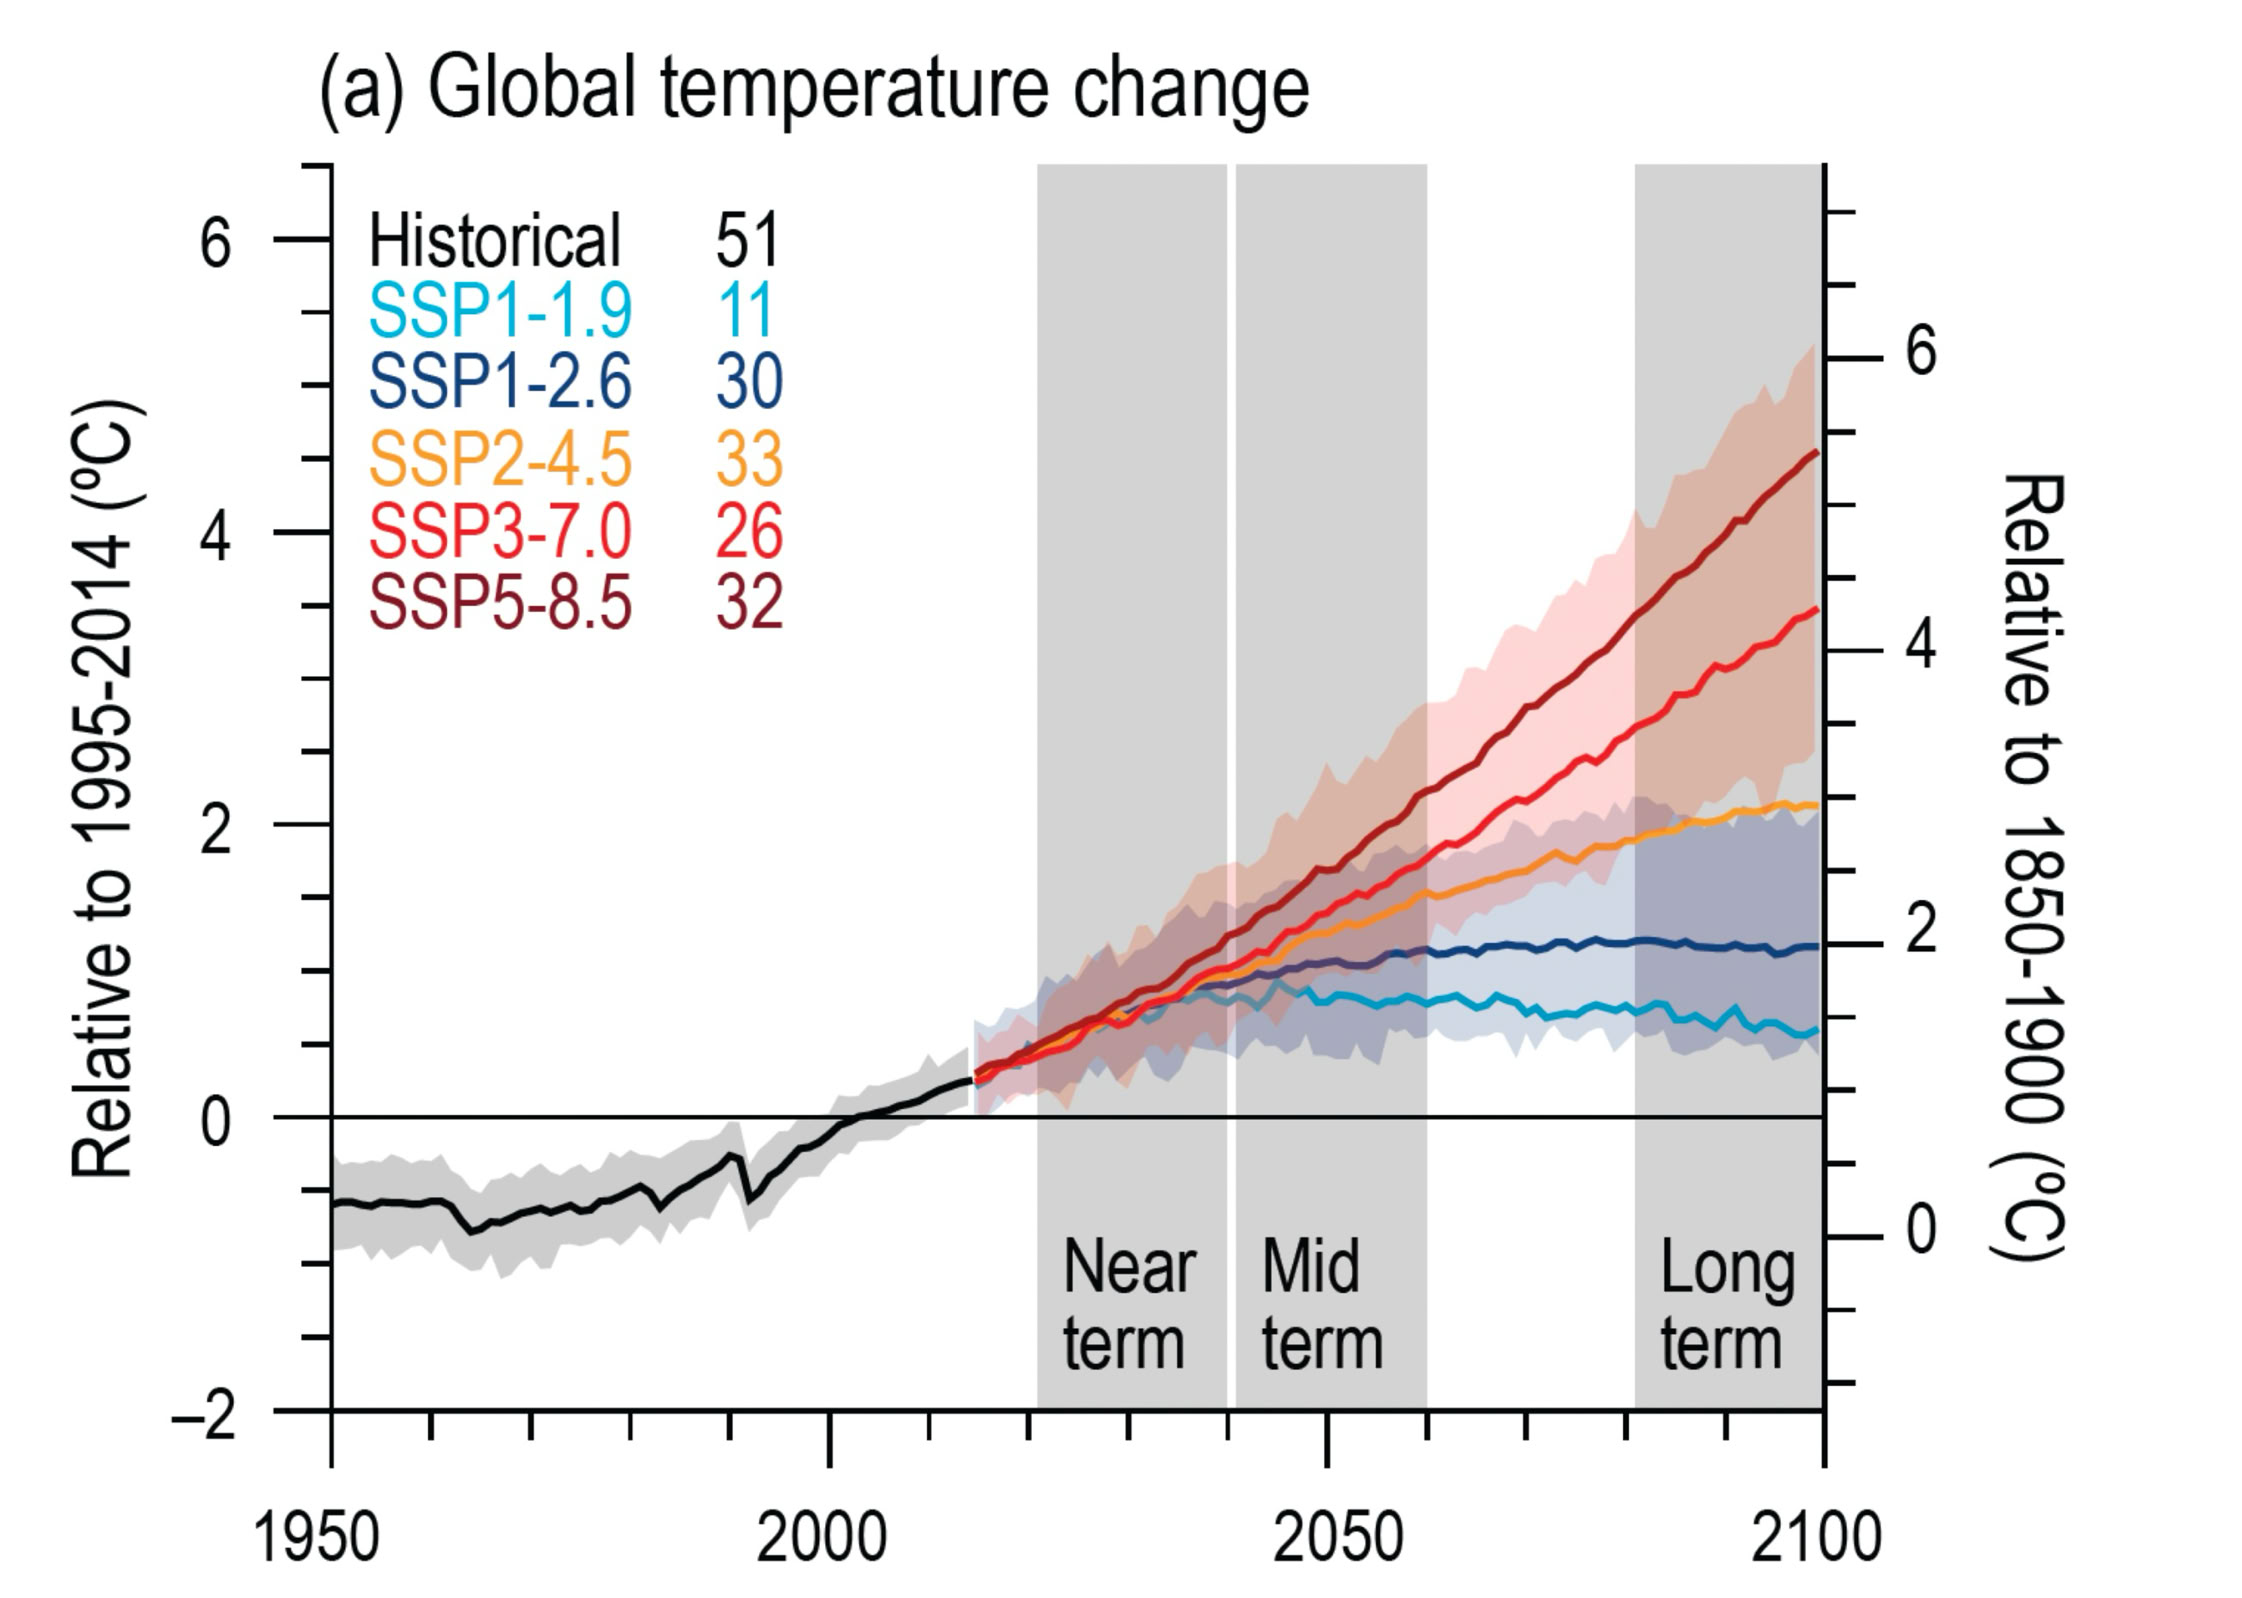
Figure 2 Global surface air temperature changes are shown relative to the 1995–2014 average on the left axis, and relative to the 1850–1900 baseline on the right axis, using an offset of 0.82 °C that reflects the multi‑model mean and aligns closely with observational estimates. The figure includes five emissions pathways—SSP1‑1.9, SSP1‑2.6, SSP2‑4.5, SSP3‑7.0, and SSP5‑8.5. Shaded bands around the SSP1‑2.6 and SSP3‑7.0 trajectories indicate the 5–95% confidence ranges. Image Source: IPCC, 2021. Figure 4.2.
Table 1 Forecasted change in global mean surface air temperature according to the most recent IPCC climate model simulations relative to 1986-2005. Source: IPCC, 2021.
Copyright © 2026 Michael Pidwirny