Penticton - Past Climate
The reconstruction of Penticton’s climate record from 1951 to today, comes from a single weather station with two records (see map Figure 1):
1) Airport, station ID 1126150. January 1, 1951 to May 9, 2012.
2) Airport, station ID 1126146. May 10, 2012 to today.
In this analysis, the airport weather station was set as the primary station for Penticton. Data from the Summerland station was used to complete some missing data in the Penticton’s climate record after being numerically adjusted for micro-climatic differences relative to the airport climate record.
Annual Changes
Displayed in Figure 2 is Penticton’s annual average mean temperature from 1951 to 2025. Annual average mean temperature is calculated by adding up all of the daily mean temperatures and dividing that value by the number of days in the year (either 365 or 366). Daily mean temperature is calculated by adding the daily maximum temperature and the daily minumum temperature and dividing that value by 2. According to the best-fit line, annual average mean temperature has increased by 1.33°C in 75 years.
Figure 3 shows annual average maximum and minimum temperature from 1951 to 2025. Both temperature measures show a stead increase over 75 years. Annual average minimum temperatures are increasing at the same rate as the annual average maximum temperatures.
Figure 4 shows annual precipitation from 1951 to 2025. Annual precipitation is the total amount of rain and snow that fell during the calendar year. The graph indicates that annual precipitation was on average higher between 1980 and 2018. There appears to be a trend of declining annual precipitation since 2018.
Seasonal Changes
Figure 5 shows spring (March, April, and May) average mean temperatures from 1951 to 2025. Over this 75-year period, spring temperatures have increase by 1.37°C.
Figure 6 shows summer (June, July, and August) average mean temperatures from 1951 to 2025. Summer temperatures have increase by 2.20°C over this 75-year period.
Figure 7 shows fall (September, October, and November) average mean temperatures from 1951 to 2025. Over this 75-year period, fall temperatures have increase by 1.04°C.
Figure 8 shows winter (previous year December, January, and February) average mean temperatures from 1952 to 2026. Over this 75-year period, winter temperatures have increase by 0.93°C.
Monthly Changes
Figure 9 shows the historical change in average monthly minimum temperatures for three periods: 1951 to 1980, 1981 to 2010, and 2011 to 2025. Between 1951 to 1980 and 2011 to 2025, average monthly minimum temperatures rose for 11 months between 0.07 to 2.33°C for 11 out 12 months. The greatest rise in temperature occurred in the January, July, August and September. Febuary saw average monthly maximum temperature declined by 0.83°C between 1951 to 1980 and 2011 to 2025.
Figure 10 displays the historical change in average monthly maximum temperatures for three periods: 1951 to 1980, 1981 to 2010, and 2011 to 2025. Between 1951 to 1980 and 2011 to 2025, average monthly maximum temperatures rose for 11 months between 0.02 to 2.17°C. The greatest rise in temperature occurred in the January, March, May, July, August, and September. February saw average monthly maximum temperature declined by 0.36°C between 1951 to 1980 and 2011 to 2025.
Days Greater Than 30°C
In Canada, an extreme maximum daily temperature is defined as an event where the temperature is greater than (>) 30°C. Figure 11 shows the yearly number of extreme maximum daily temperature events that occurred in Kelowna from 1951 to 2025. These high temperature events average around 21 at the beginning of temperature record to around 35 by 2025, a 67% increase.
Days Less Than 0°C
Figure 12 shows the number of daily minimum temperature events less than (<) 0°C per year from 1951 to 2025. Over this 75-year period, the annual number of these events has dropped by 11.
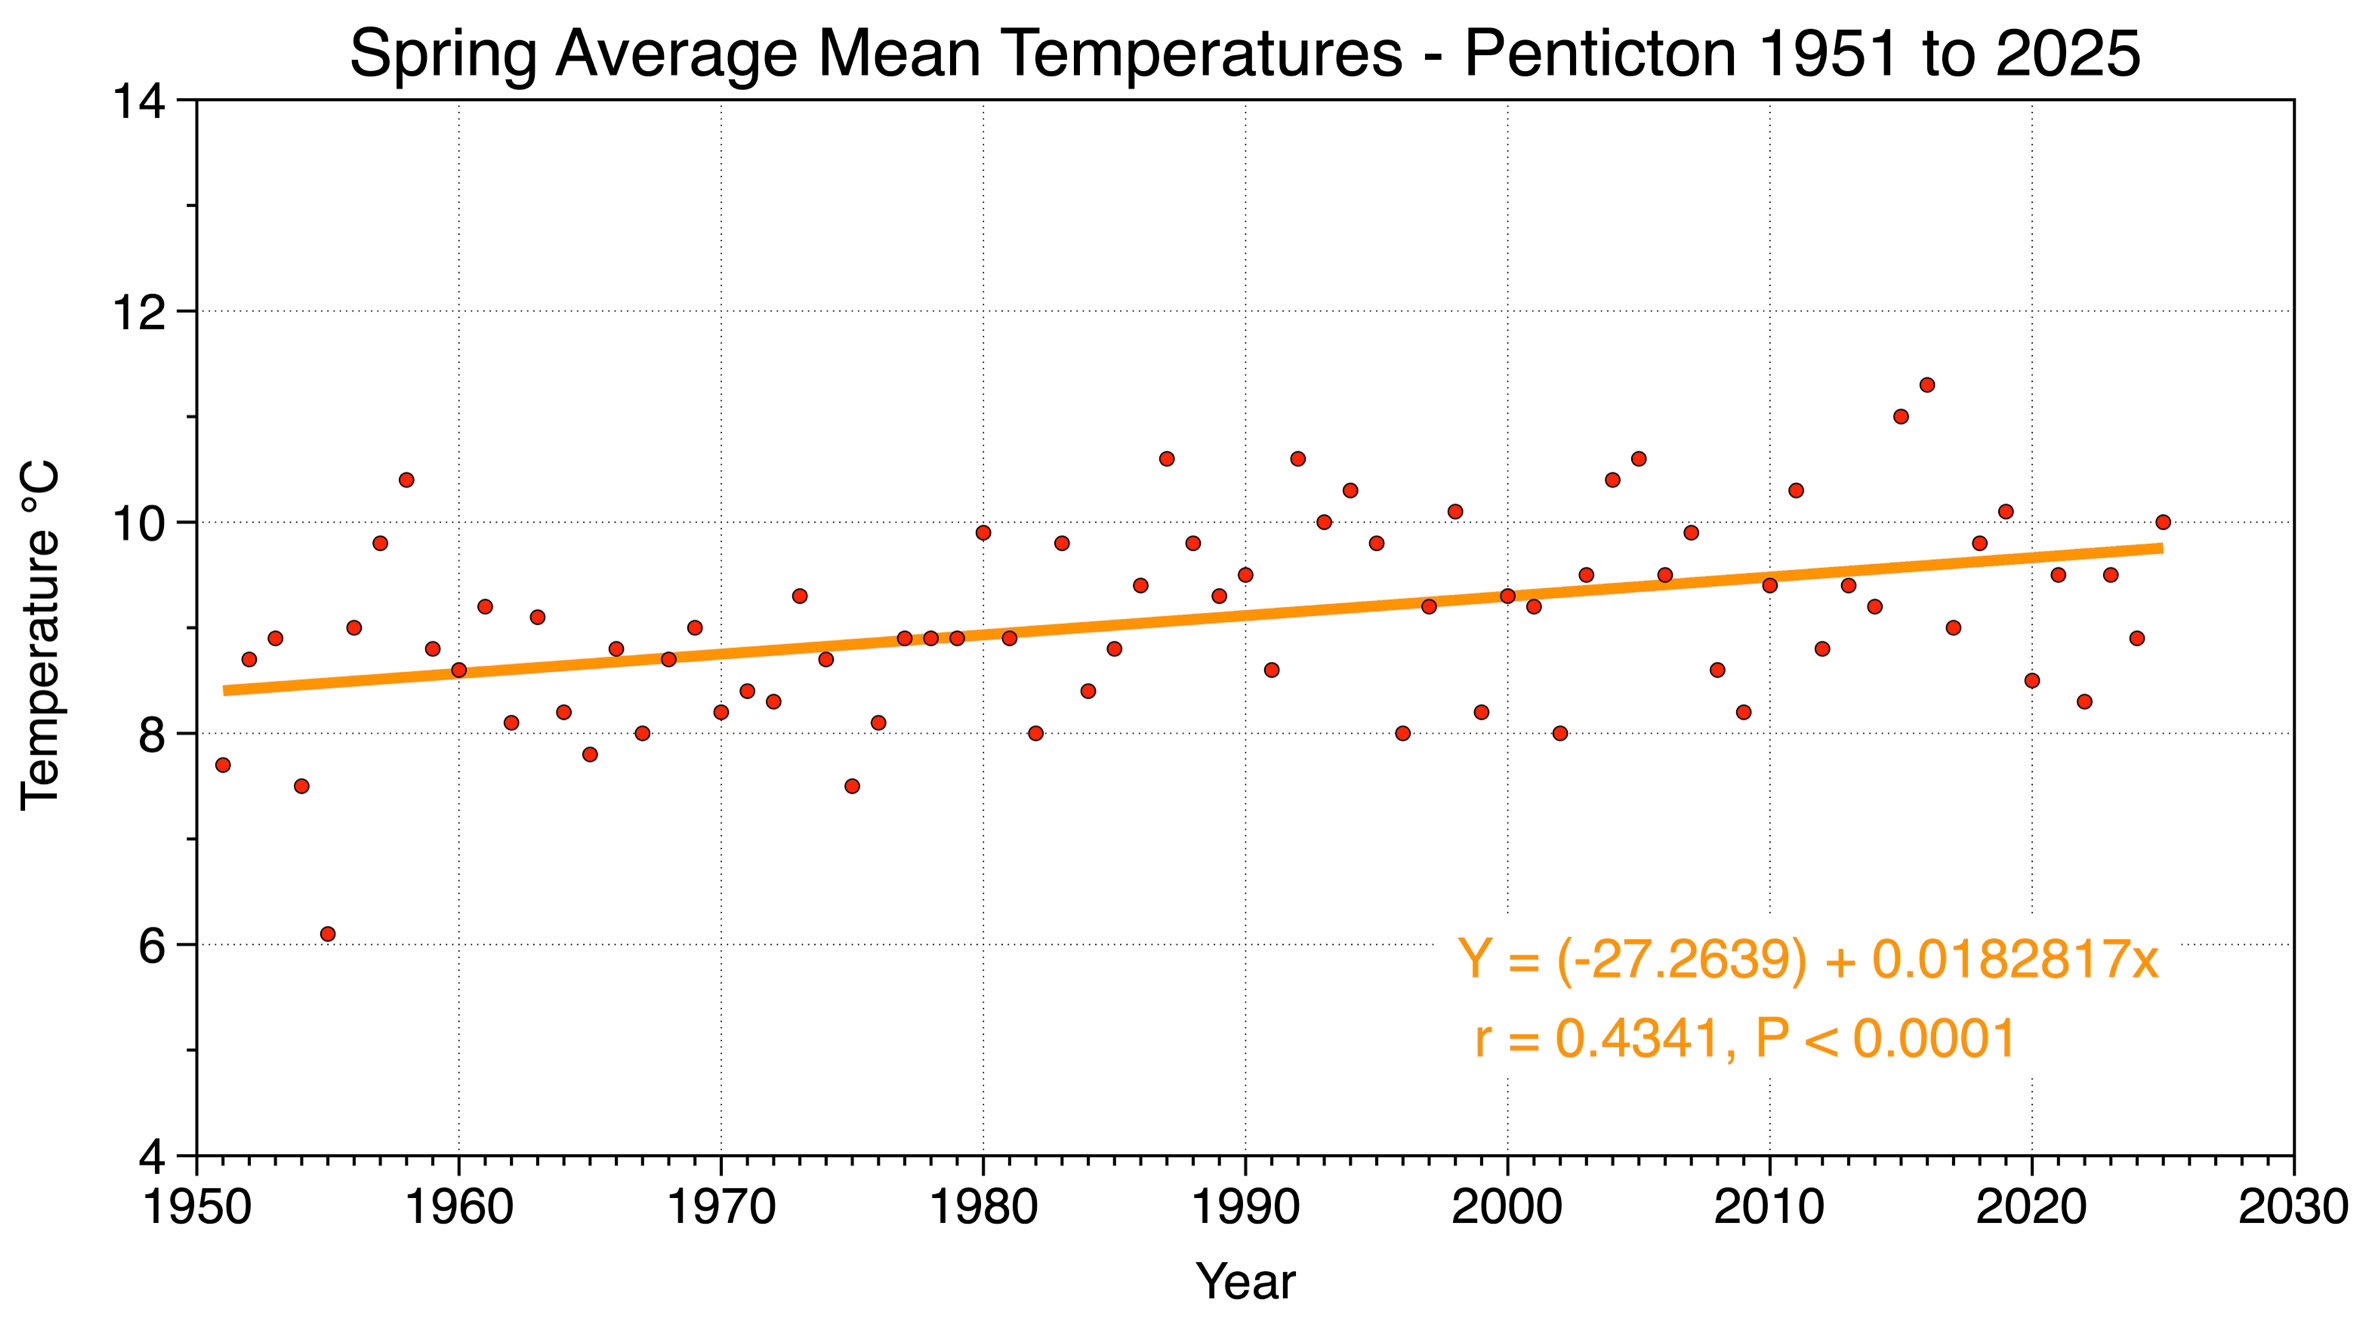
Figure 5 Penticton’s spring average mean temperatures from 1951 to 2025. Spring average mean temperature has been steadily increasing at a rate of 0.18°C per decade according to linear regression analysis.
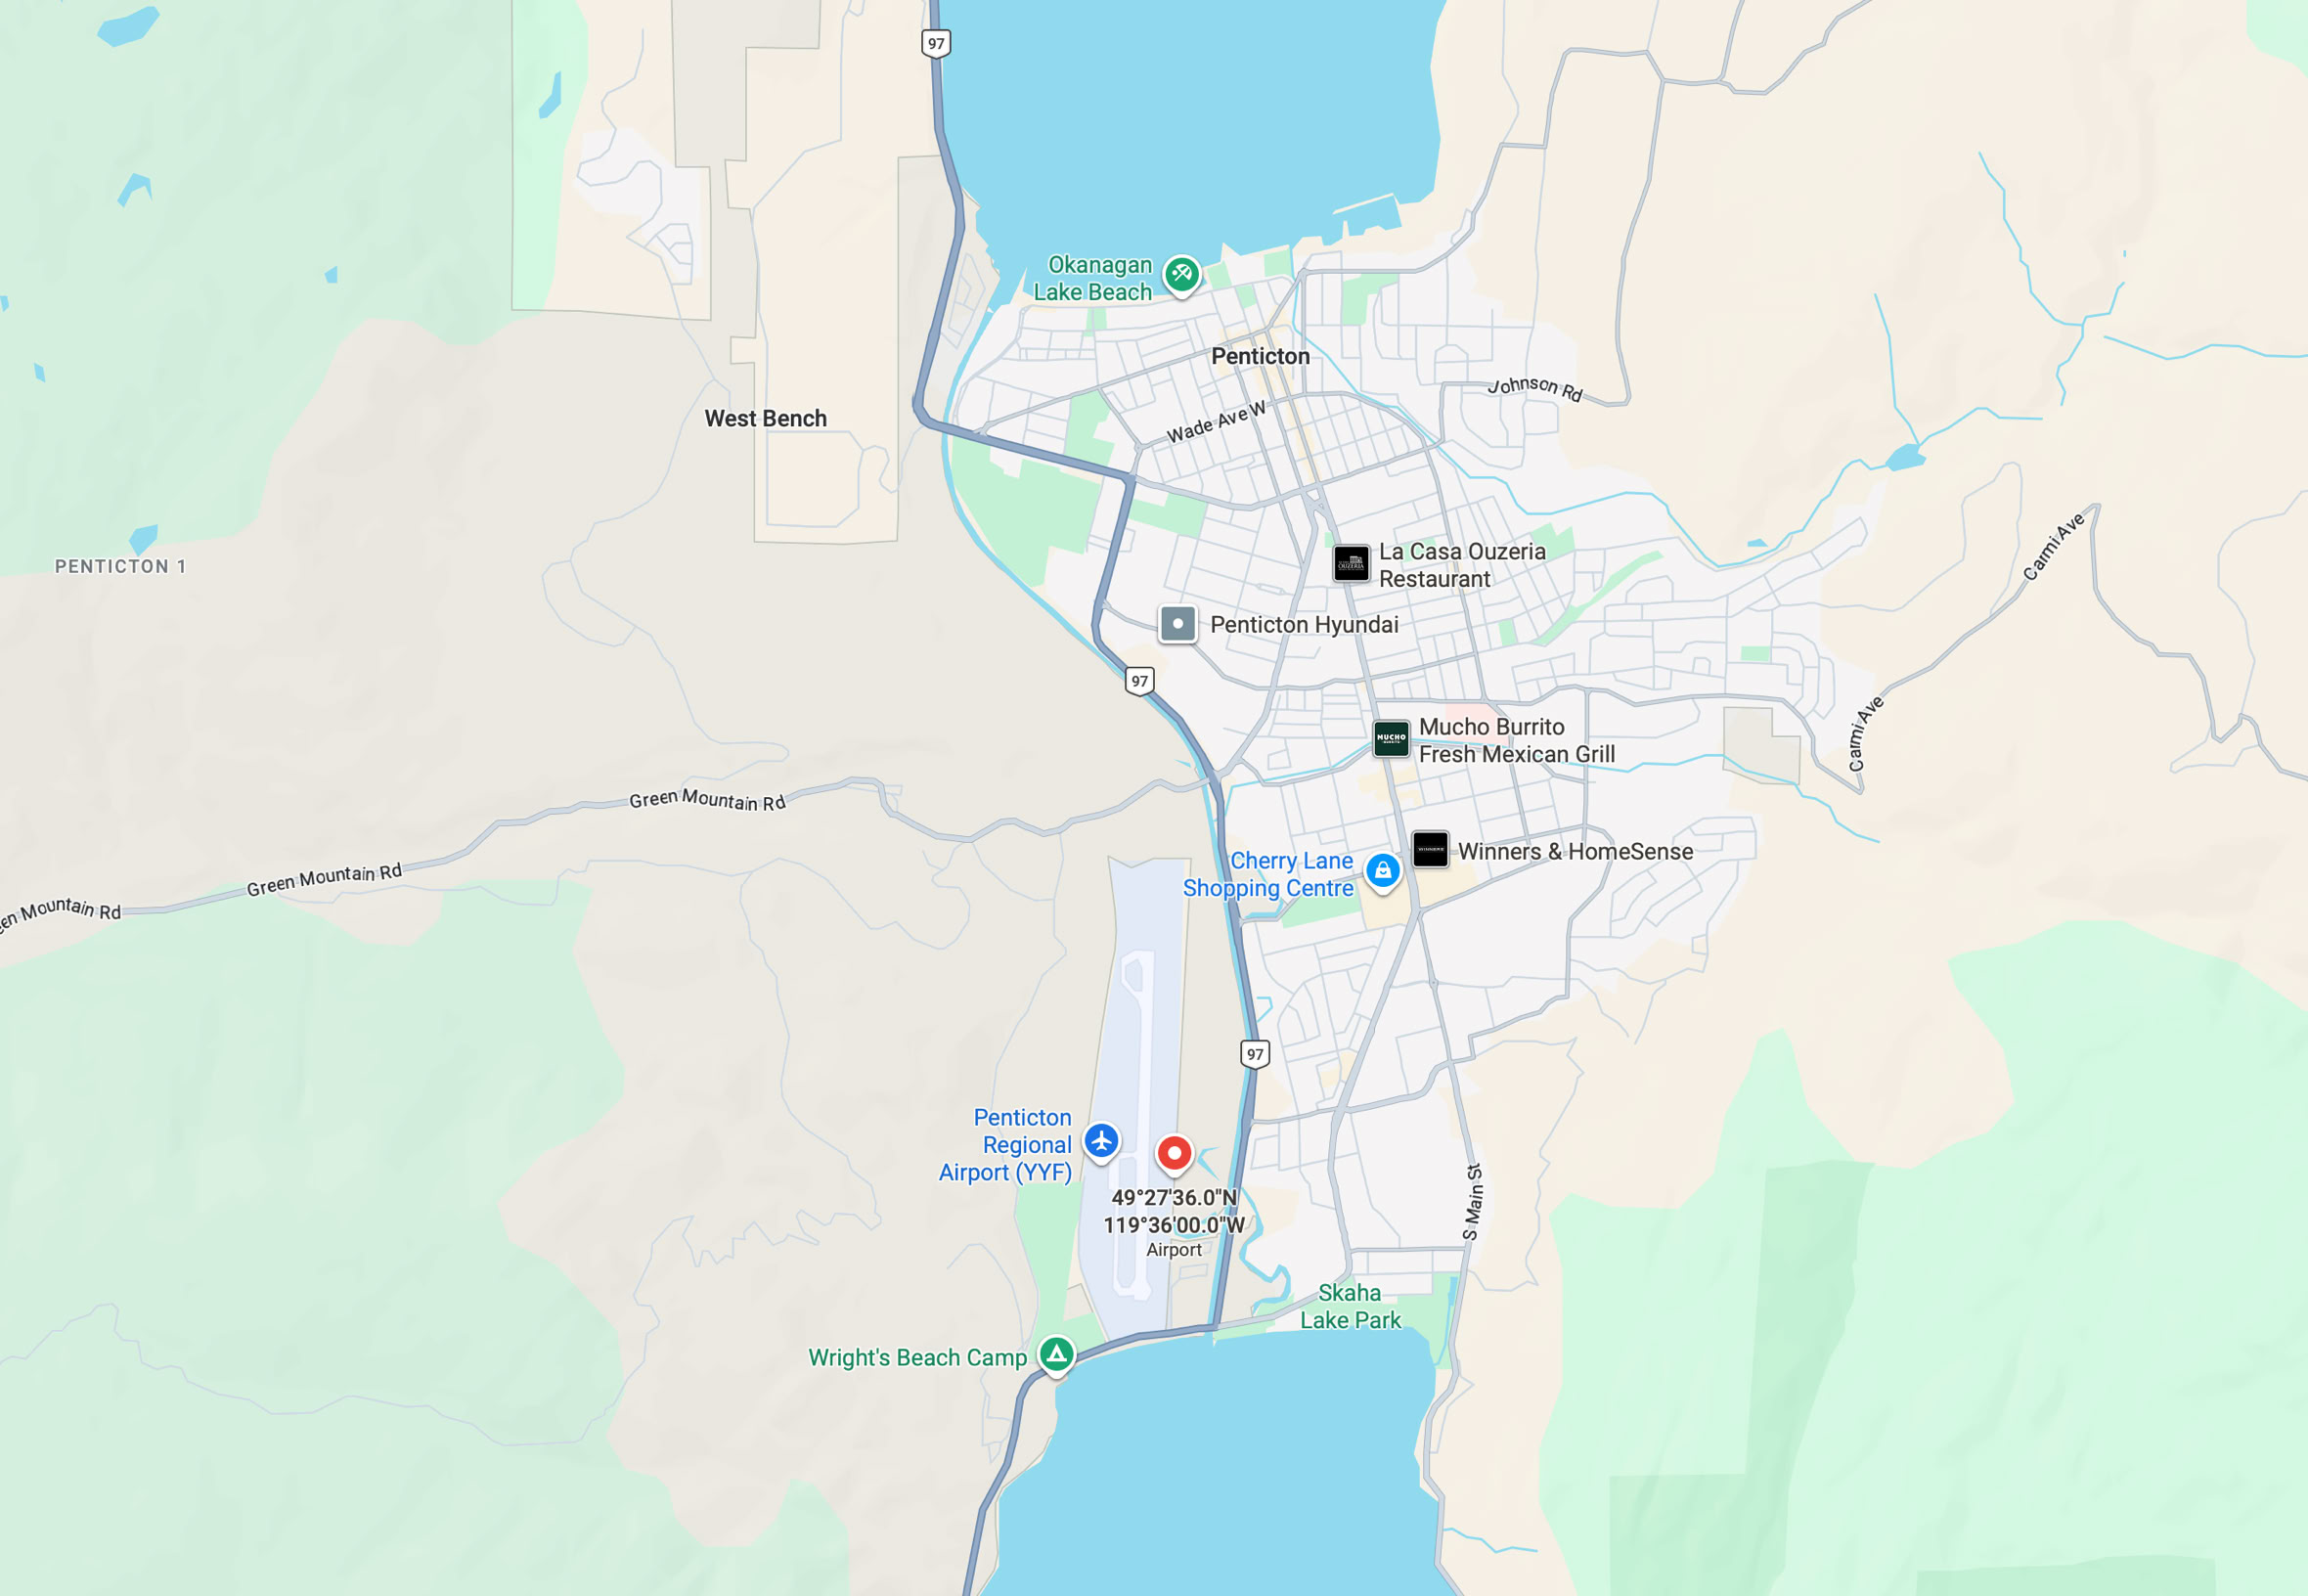
Figure 1 Location of the weather station used to reconstruct Pentictons’s climate record.
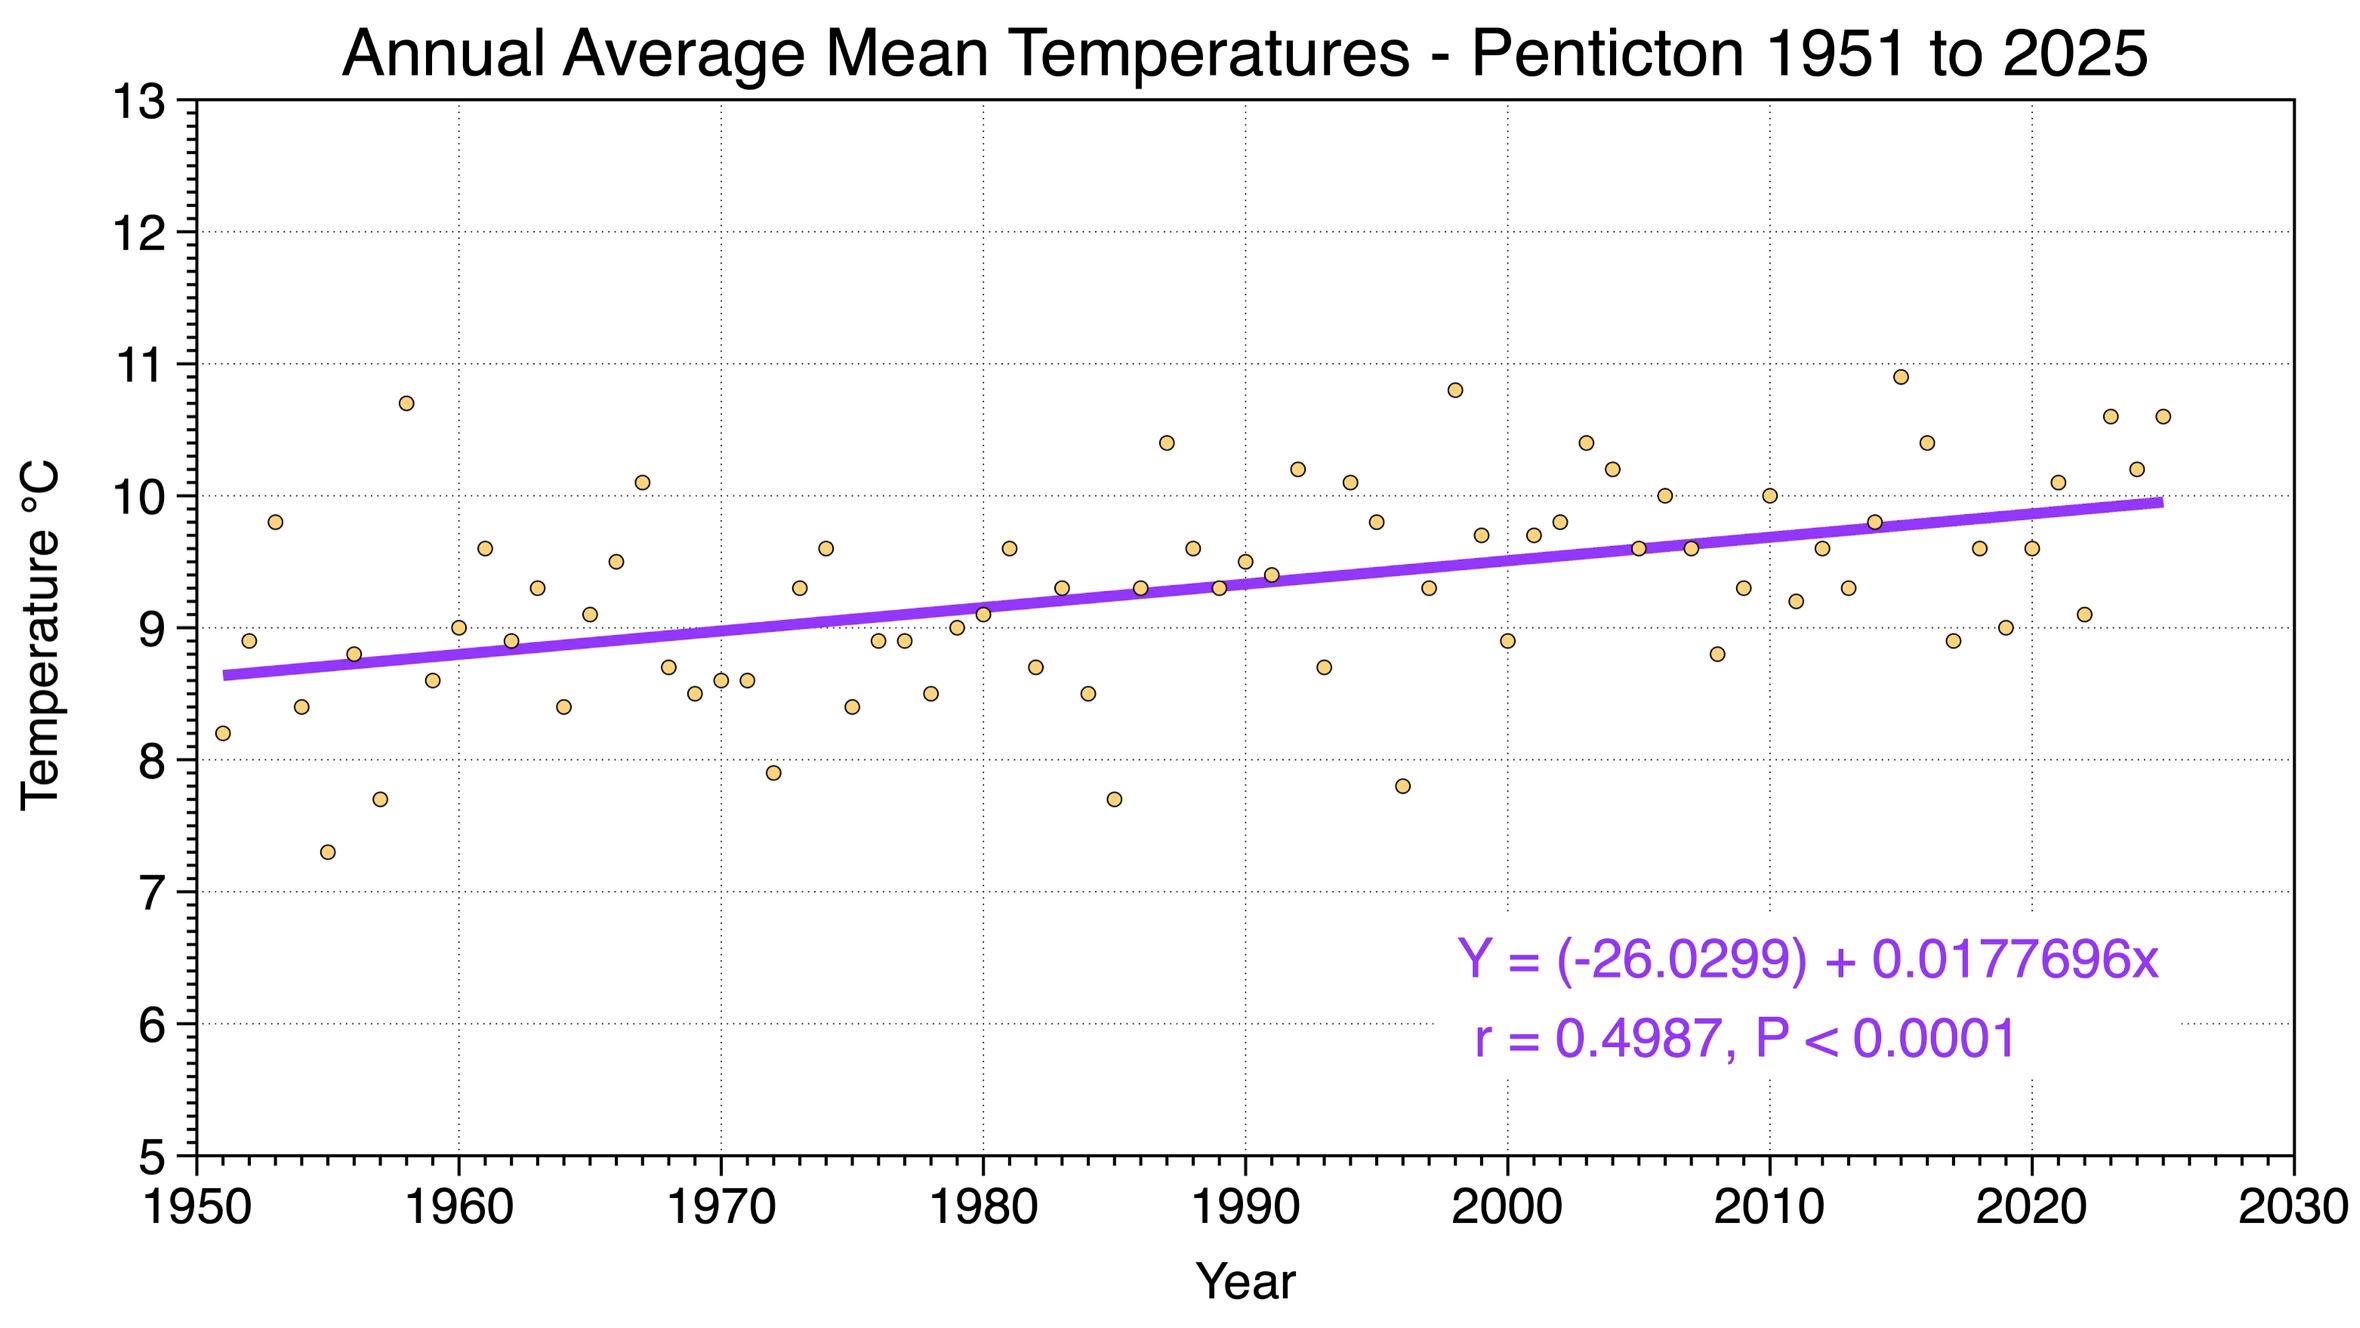
Figure 2 Penticton’s annual average mean temperatures from 1951 to 2025. Annual average mean temperature has been steadily increasing at a rate of 0.18°C per decade according to linear regression analysis.
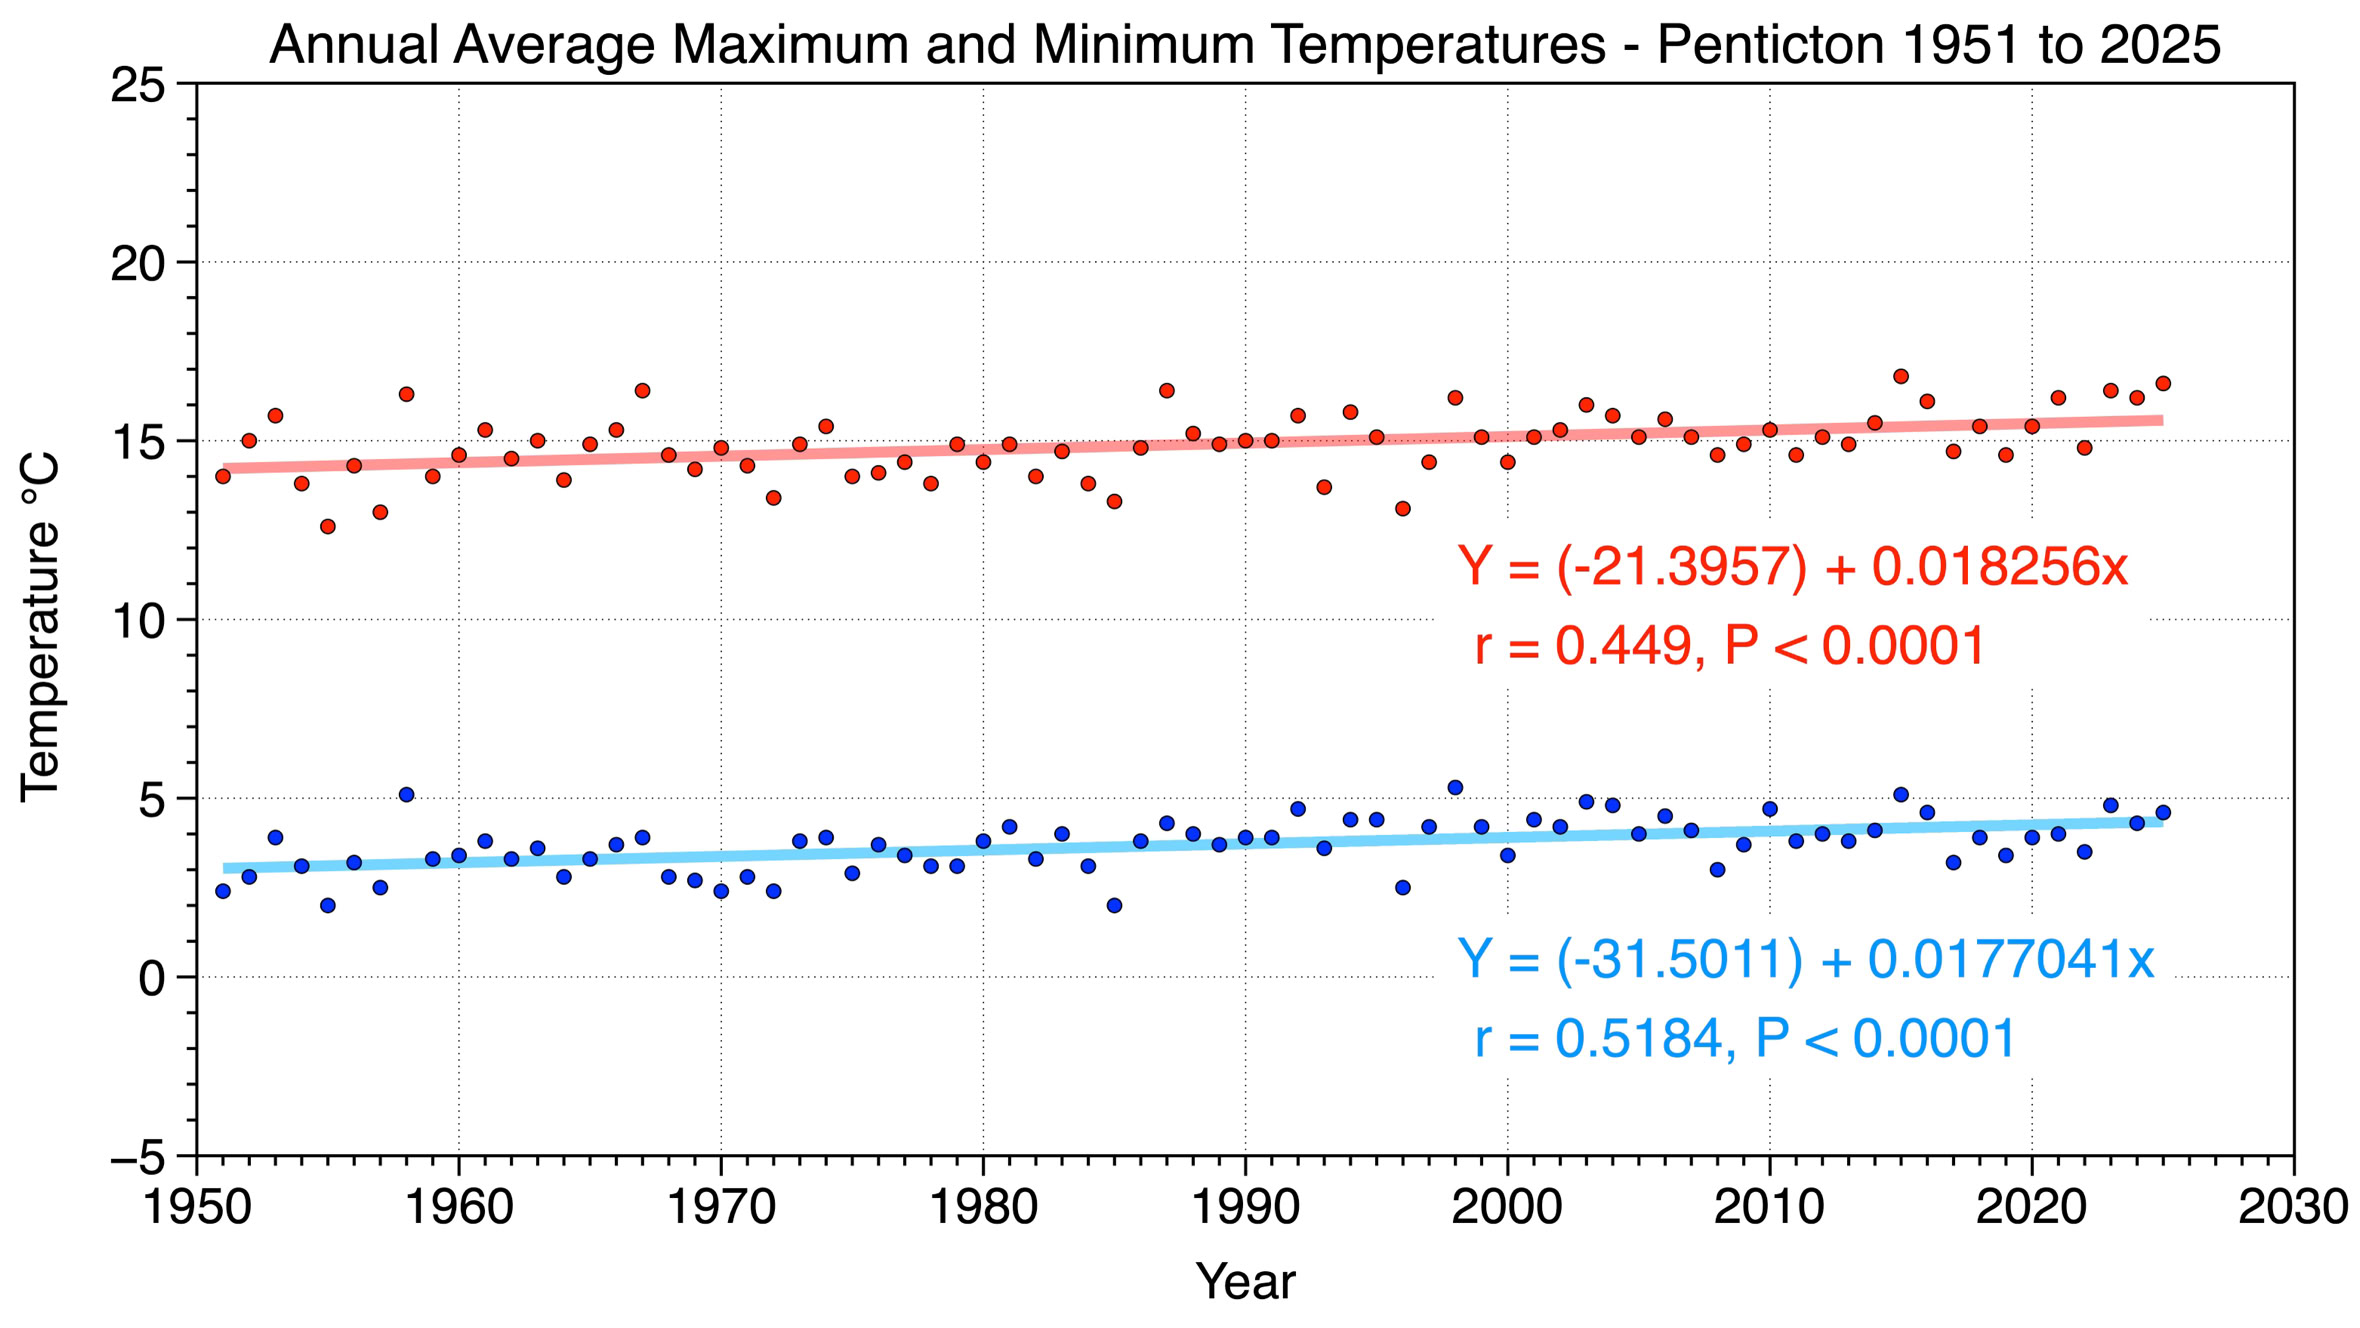
Figure 3 Penticton’s annual average maximum and minimum temperatures from 1951 to 2025. Annual average maximum temperature has been steadily increasing at a rate of 0.18°C per decade, while annual average minimum temperature has been steadily increasing at a rate of 0.18°C per decade according to linear regression analysis.
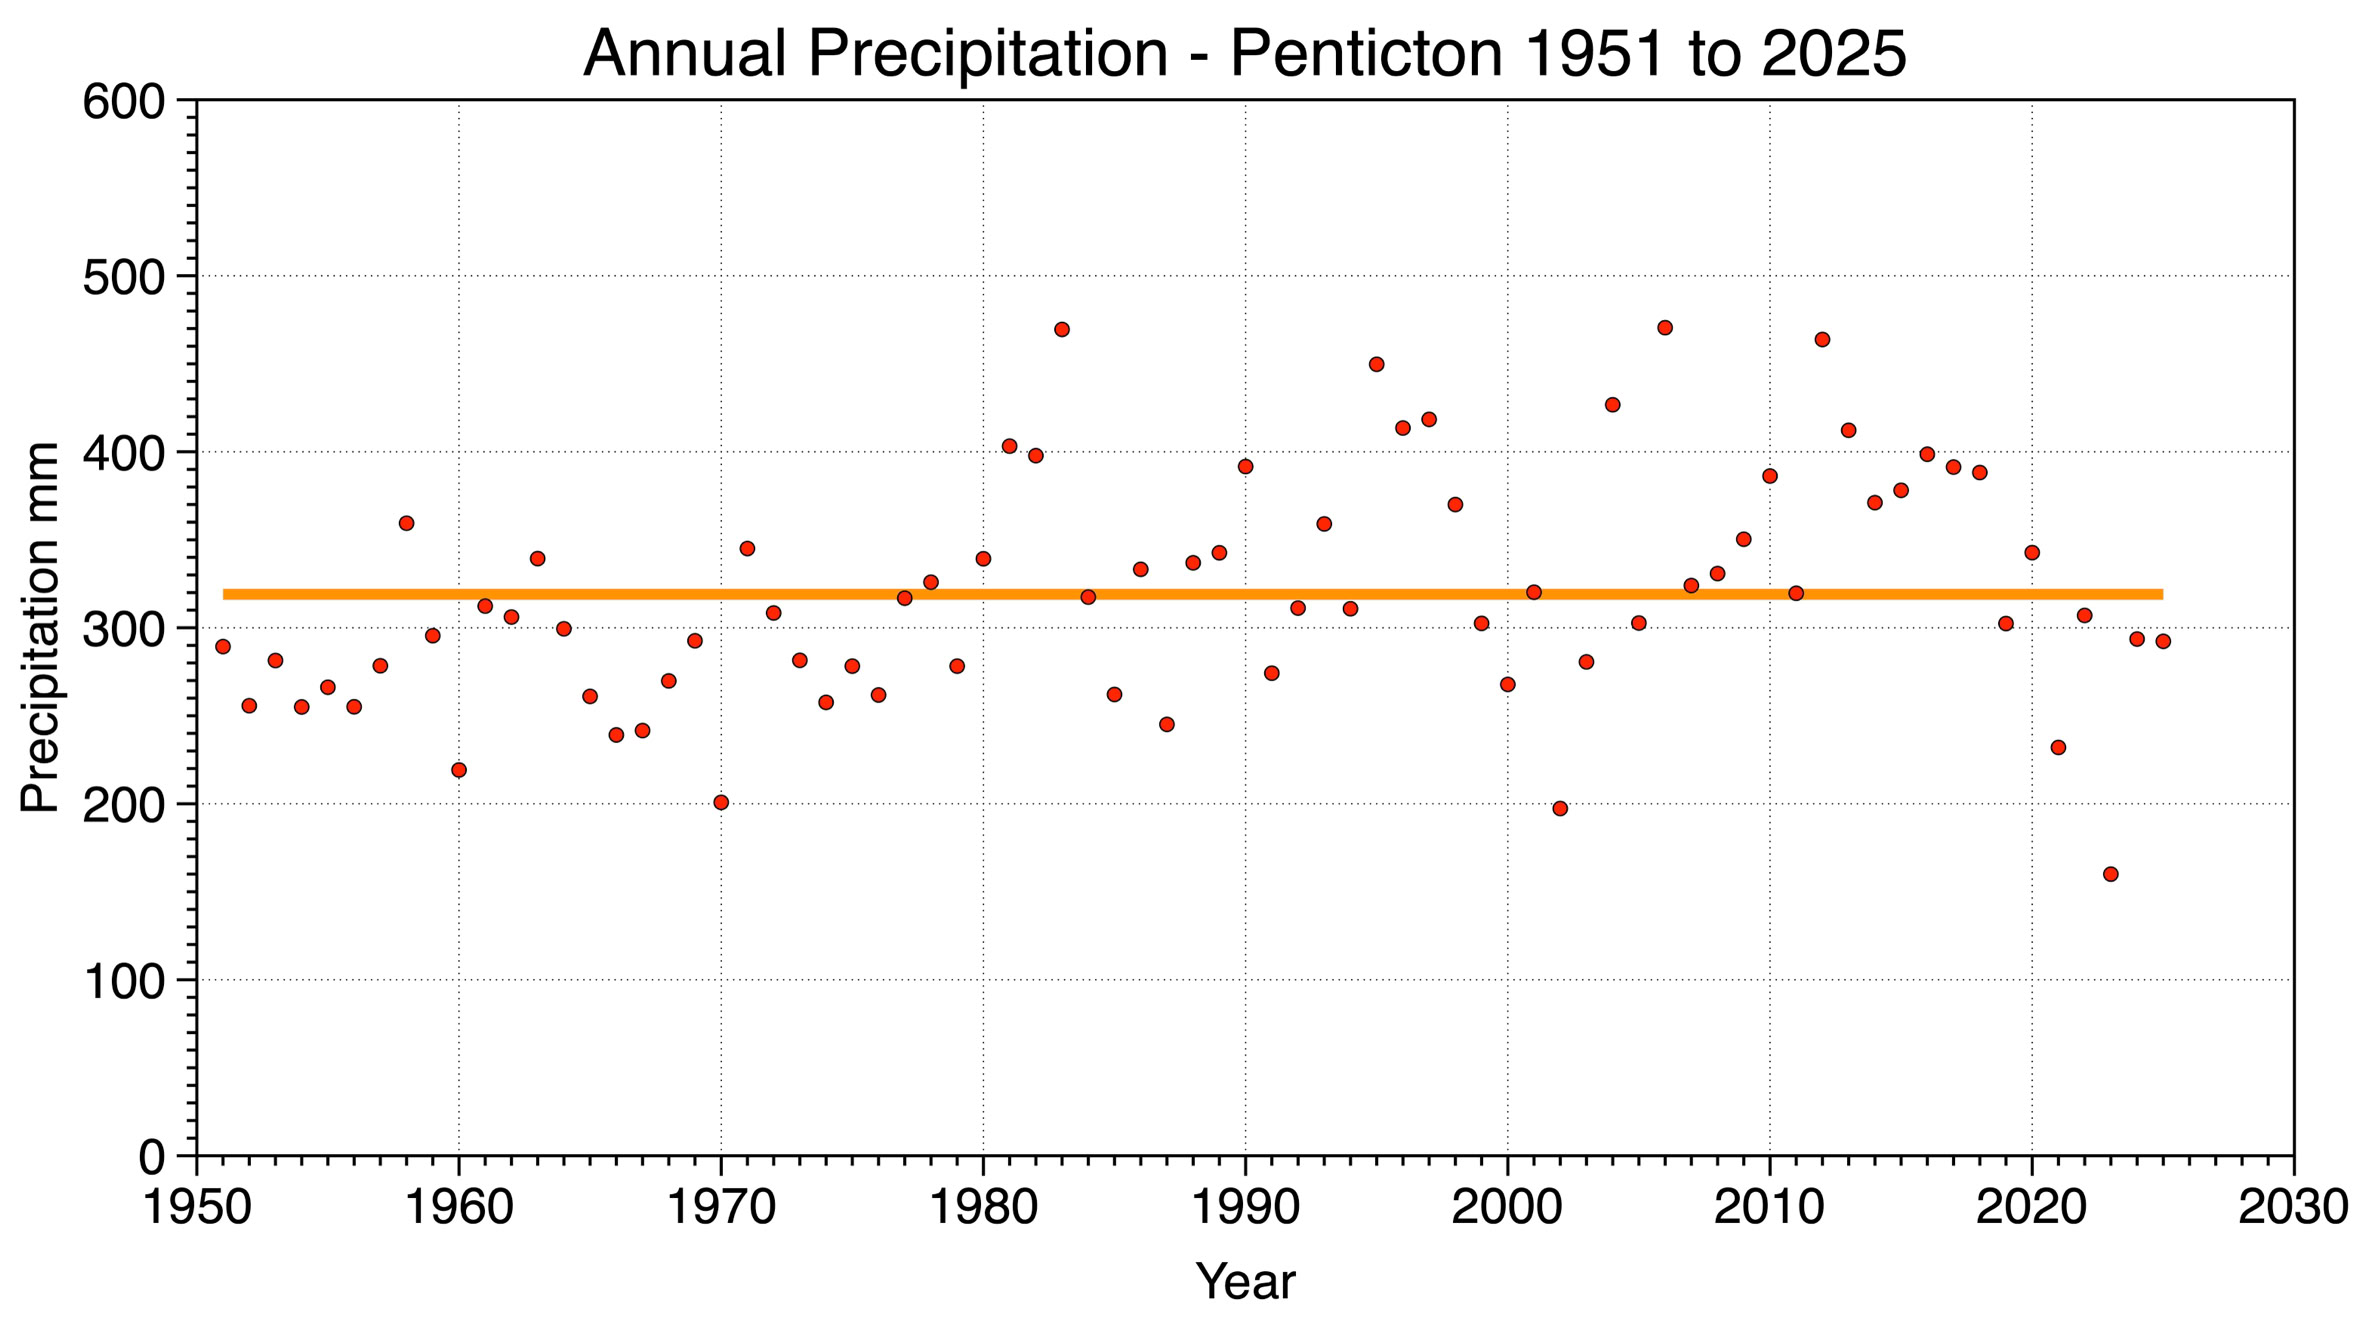
Figure 4 Penticton’s annual precipitation from 1951 to 2025. The orange line shows the average value for this period which was 319 mm.
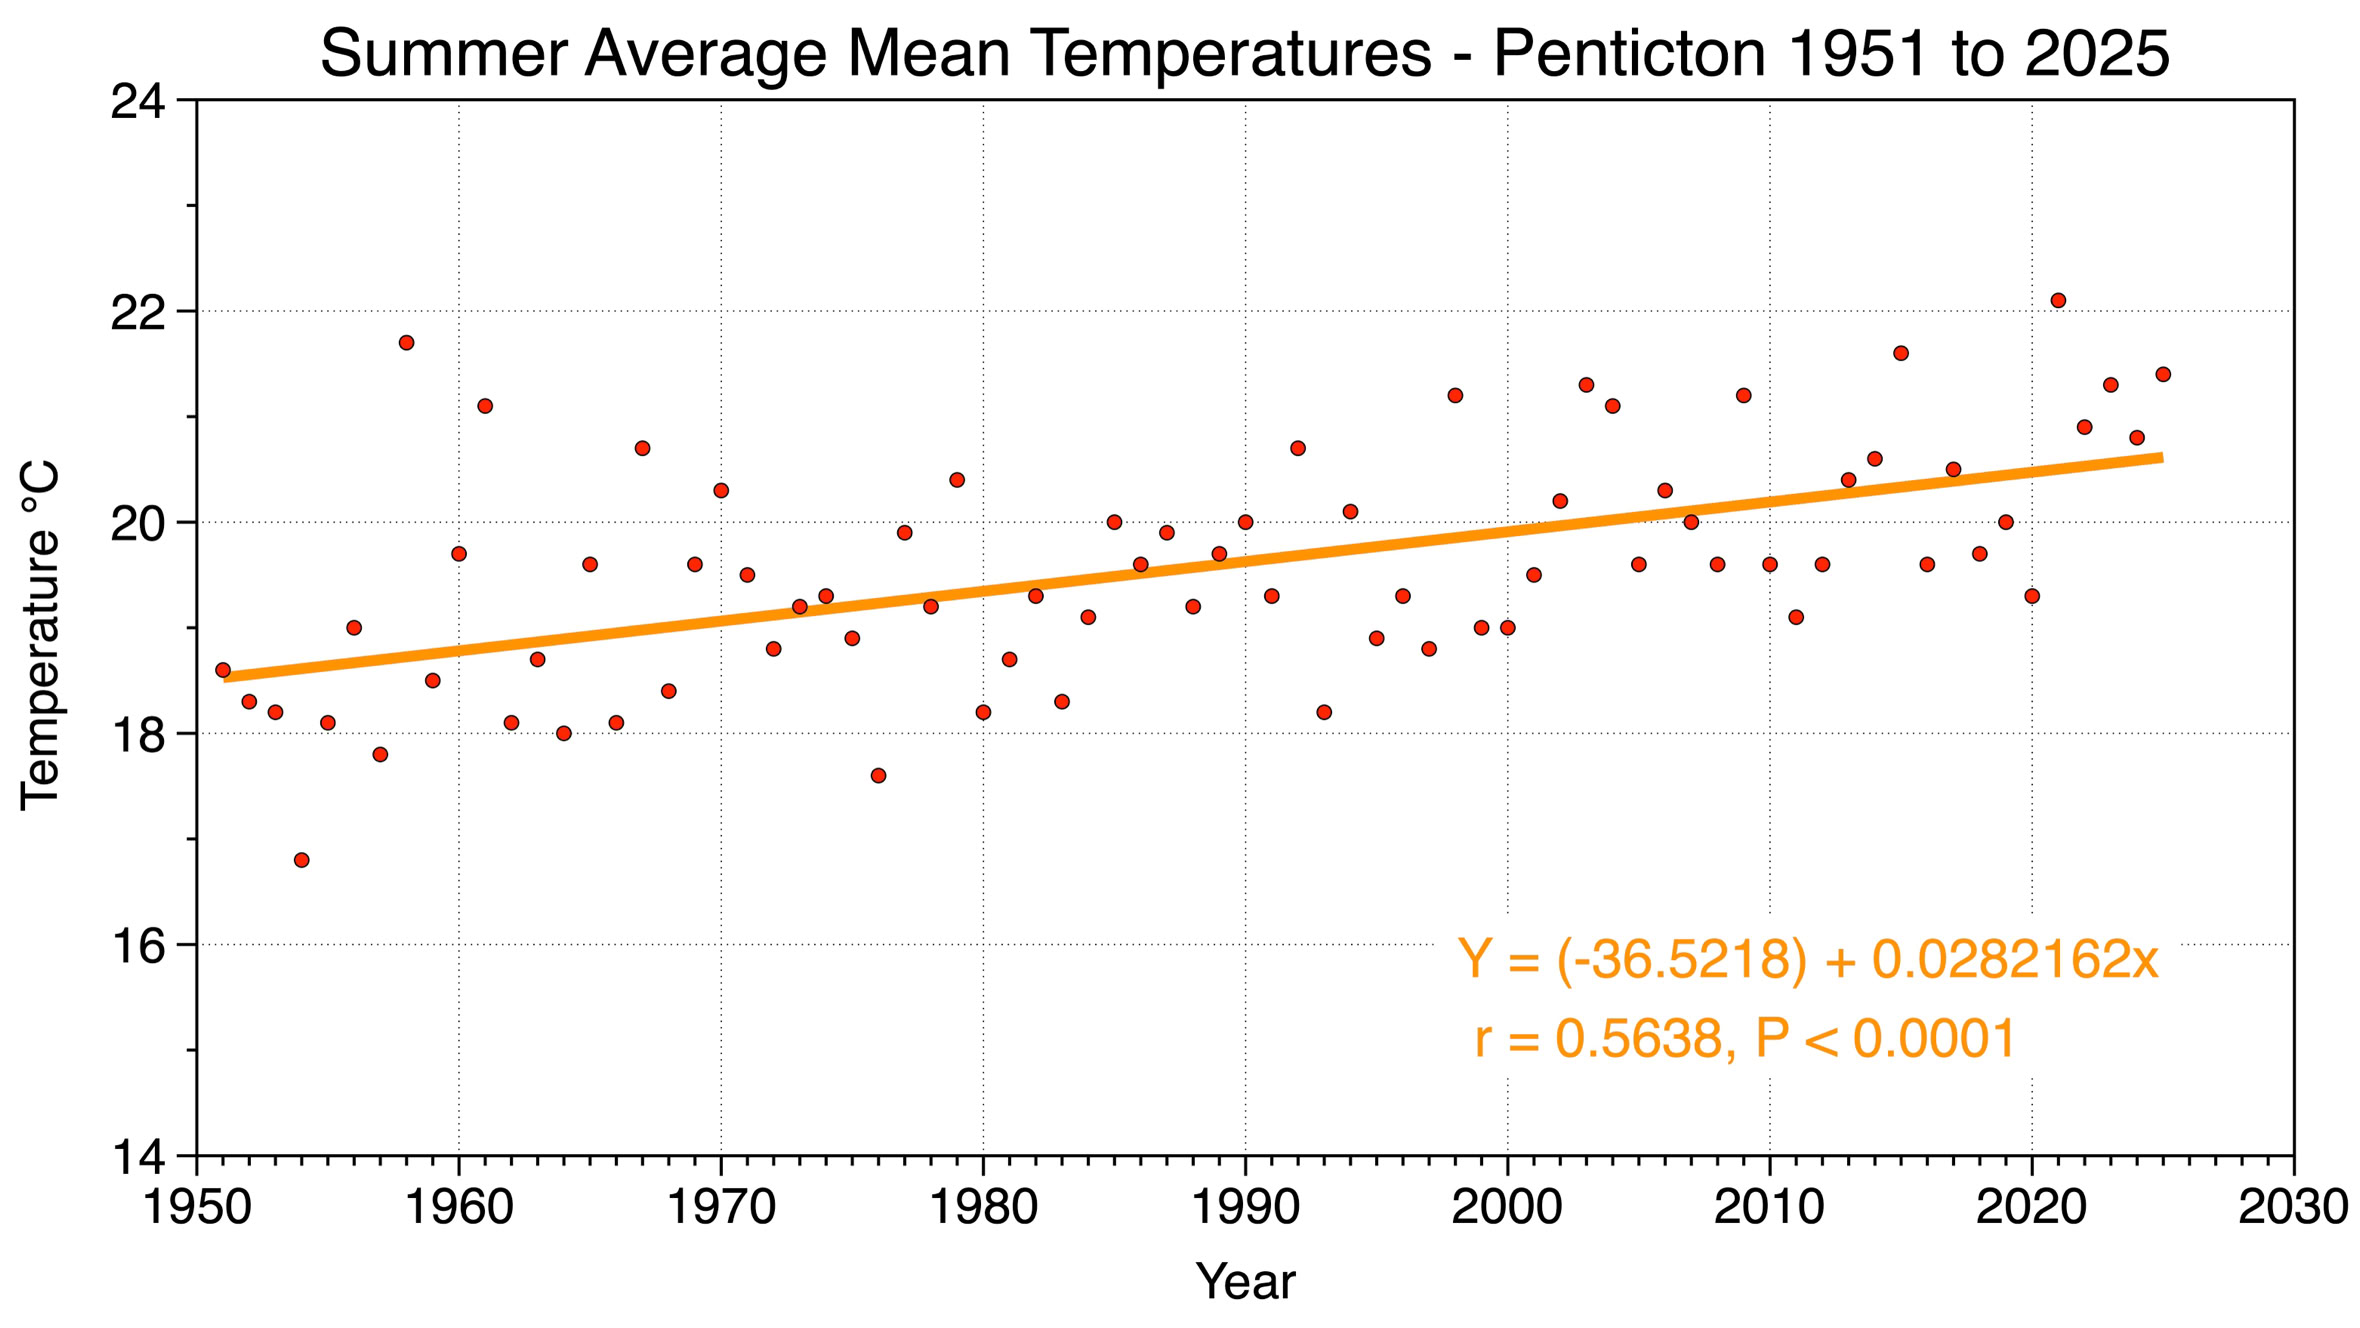
Figure 6 Penticton’s summer average mean temperatures from 1951 to 2025. Summer average mean temperature has been steadily increasing at a rate of 0.28°C per decade according to linear regression analysis.
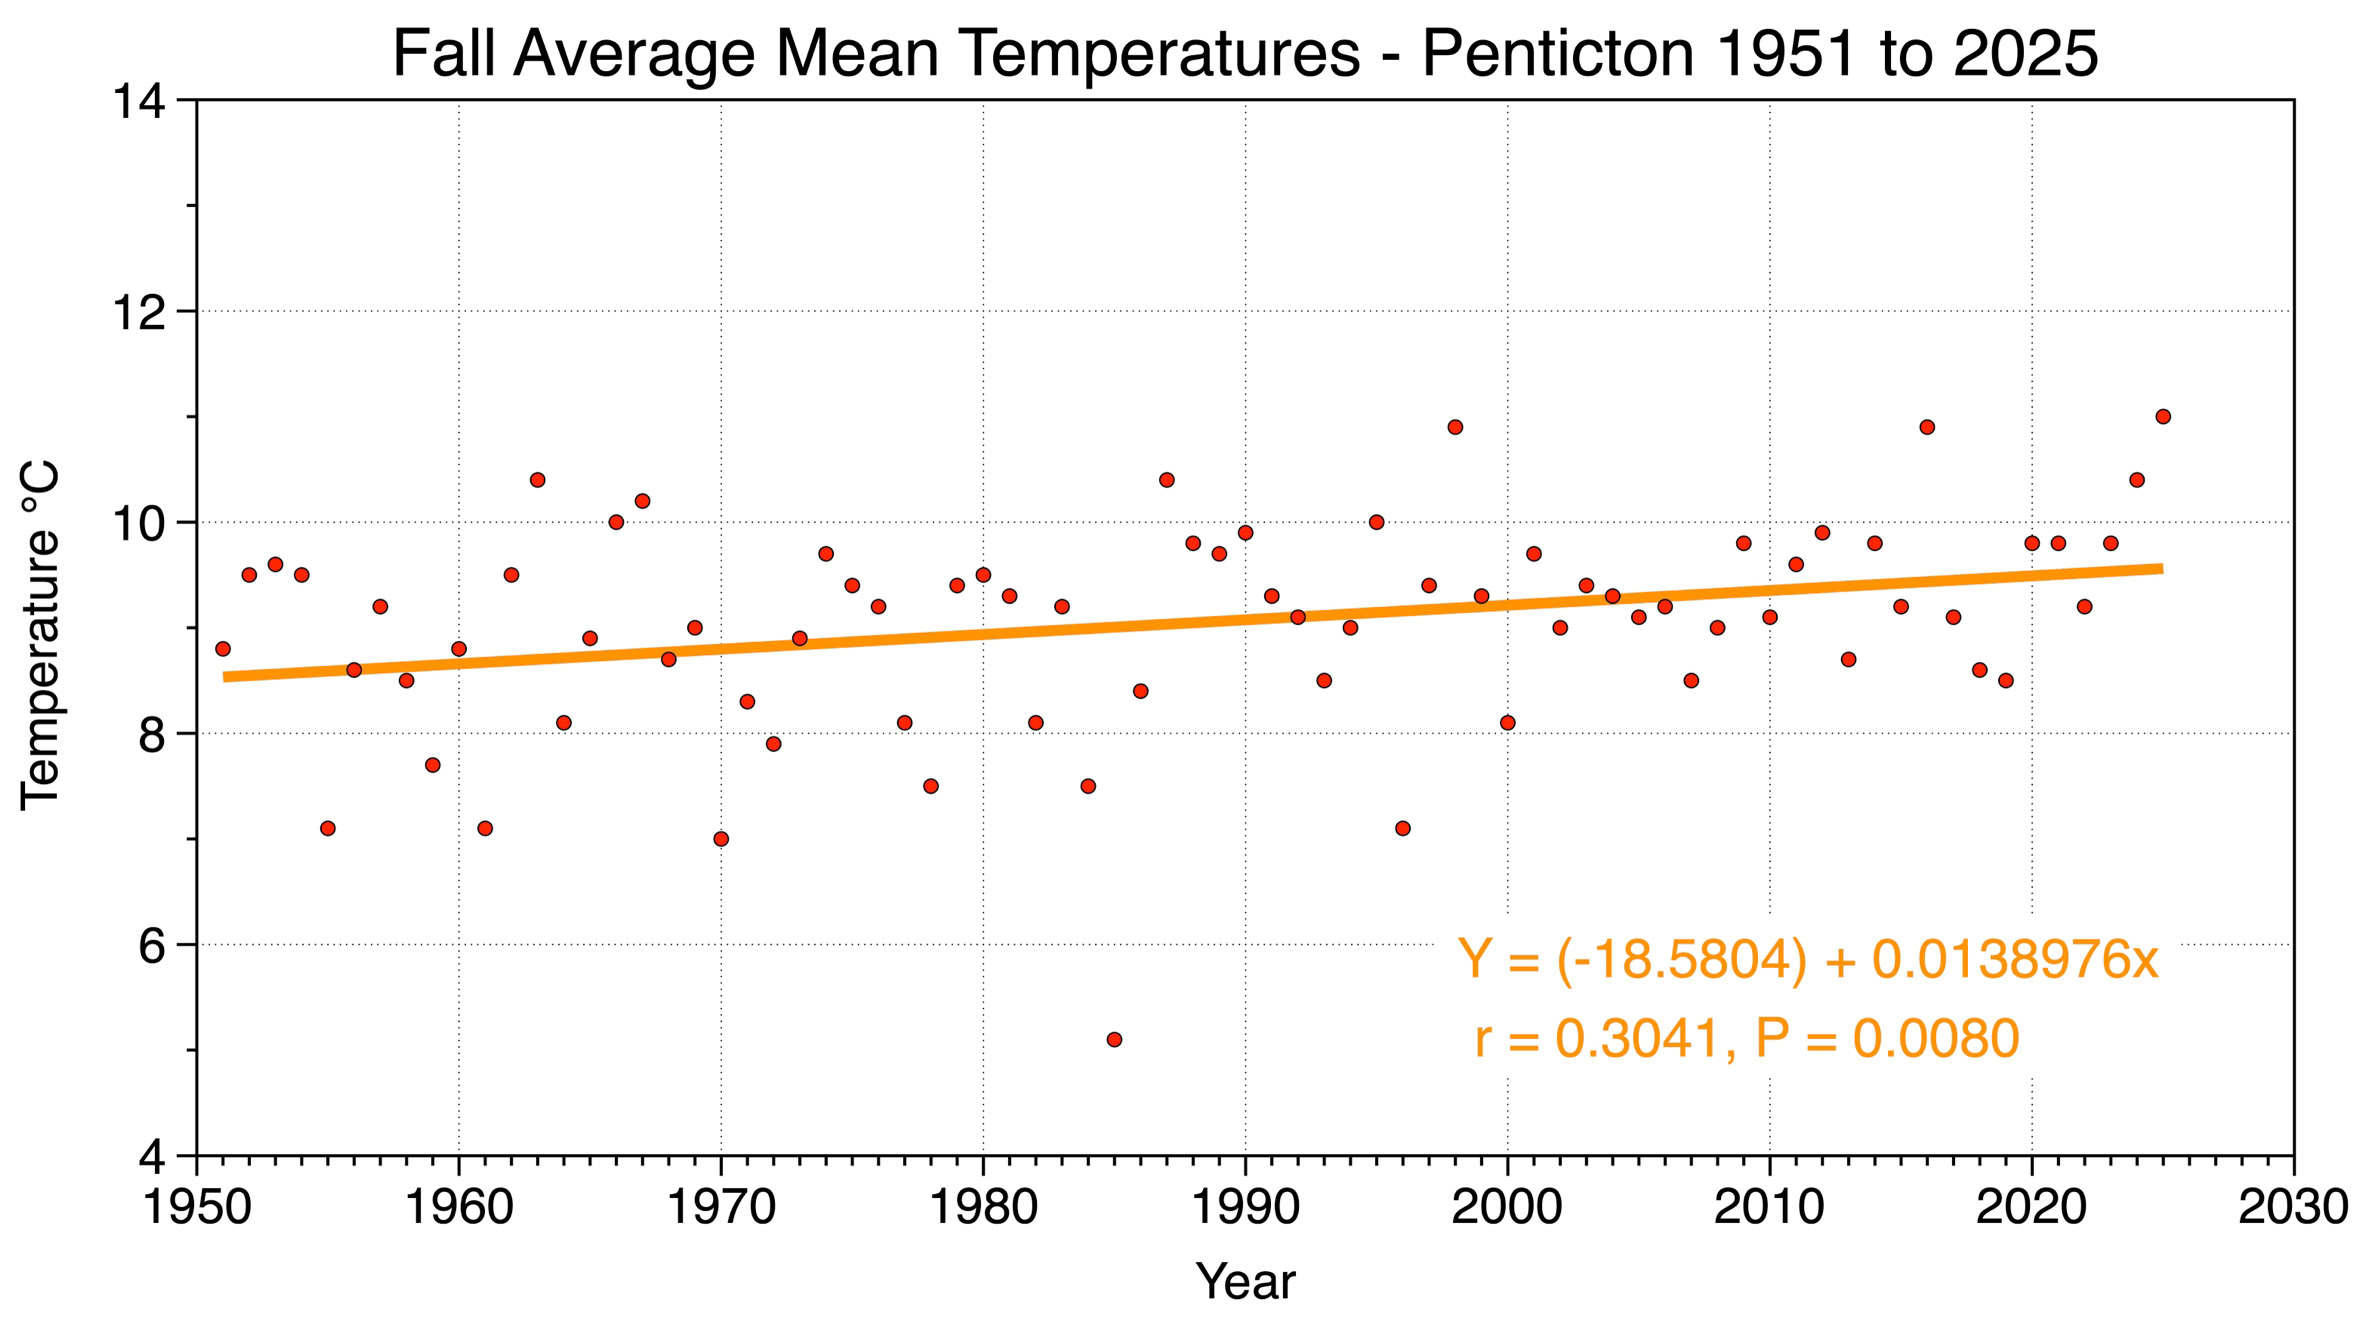
Figure 7 Penticton’s fall average mean temperatures from 1951 to 2025. Fall average mean temperature has been steadily increasing at a rate of 0.14°C per decade according to linear regression analysis.
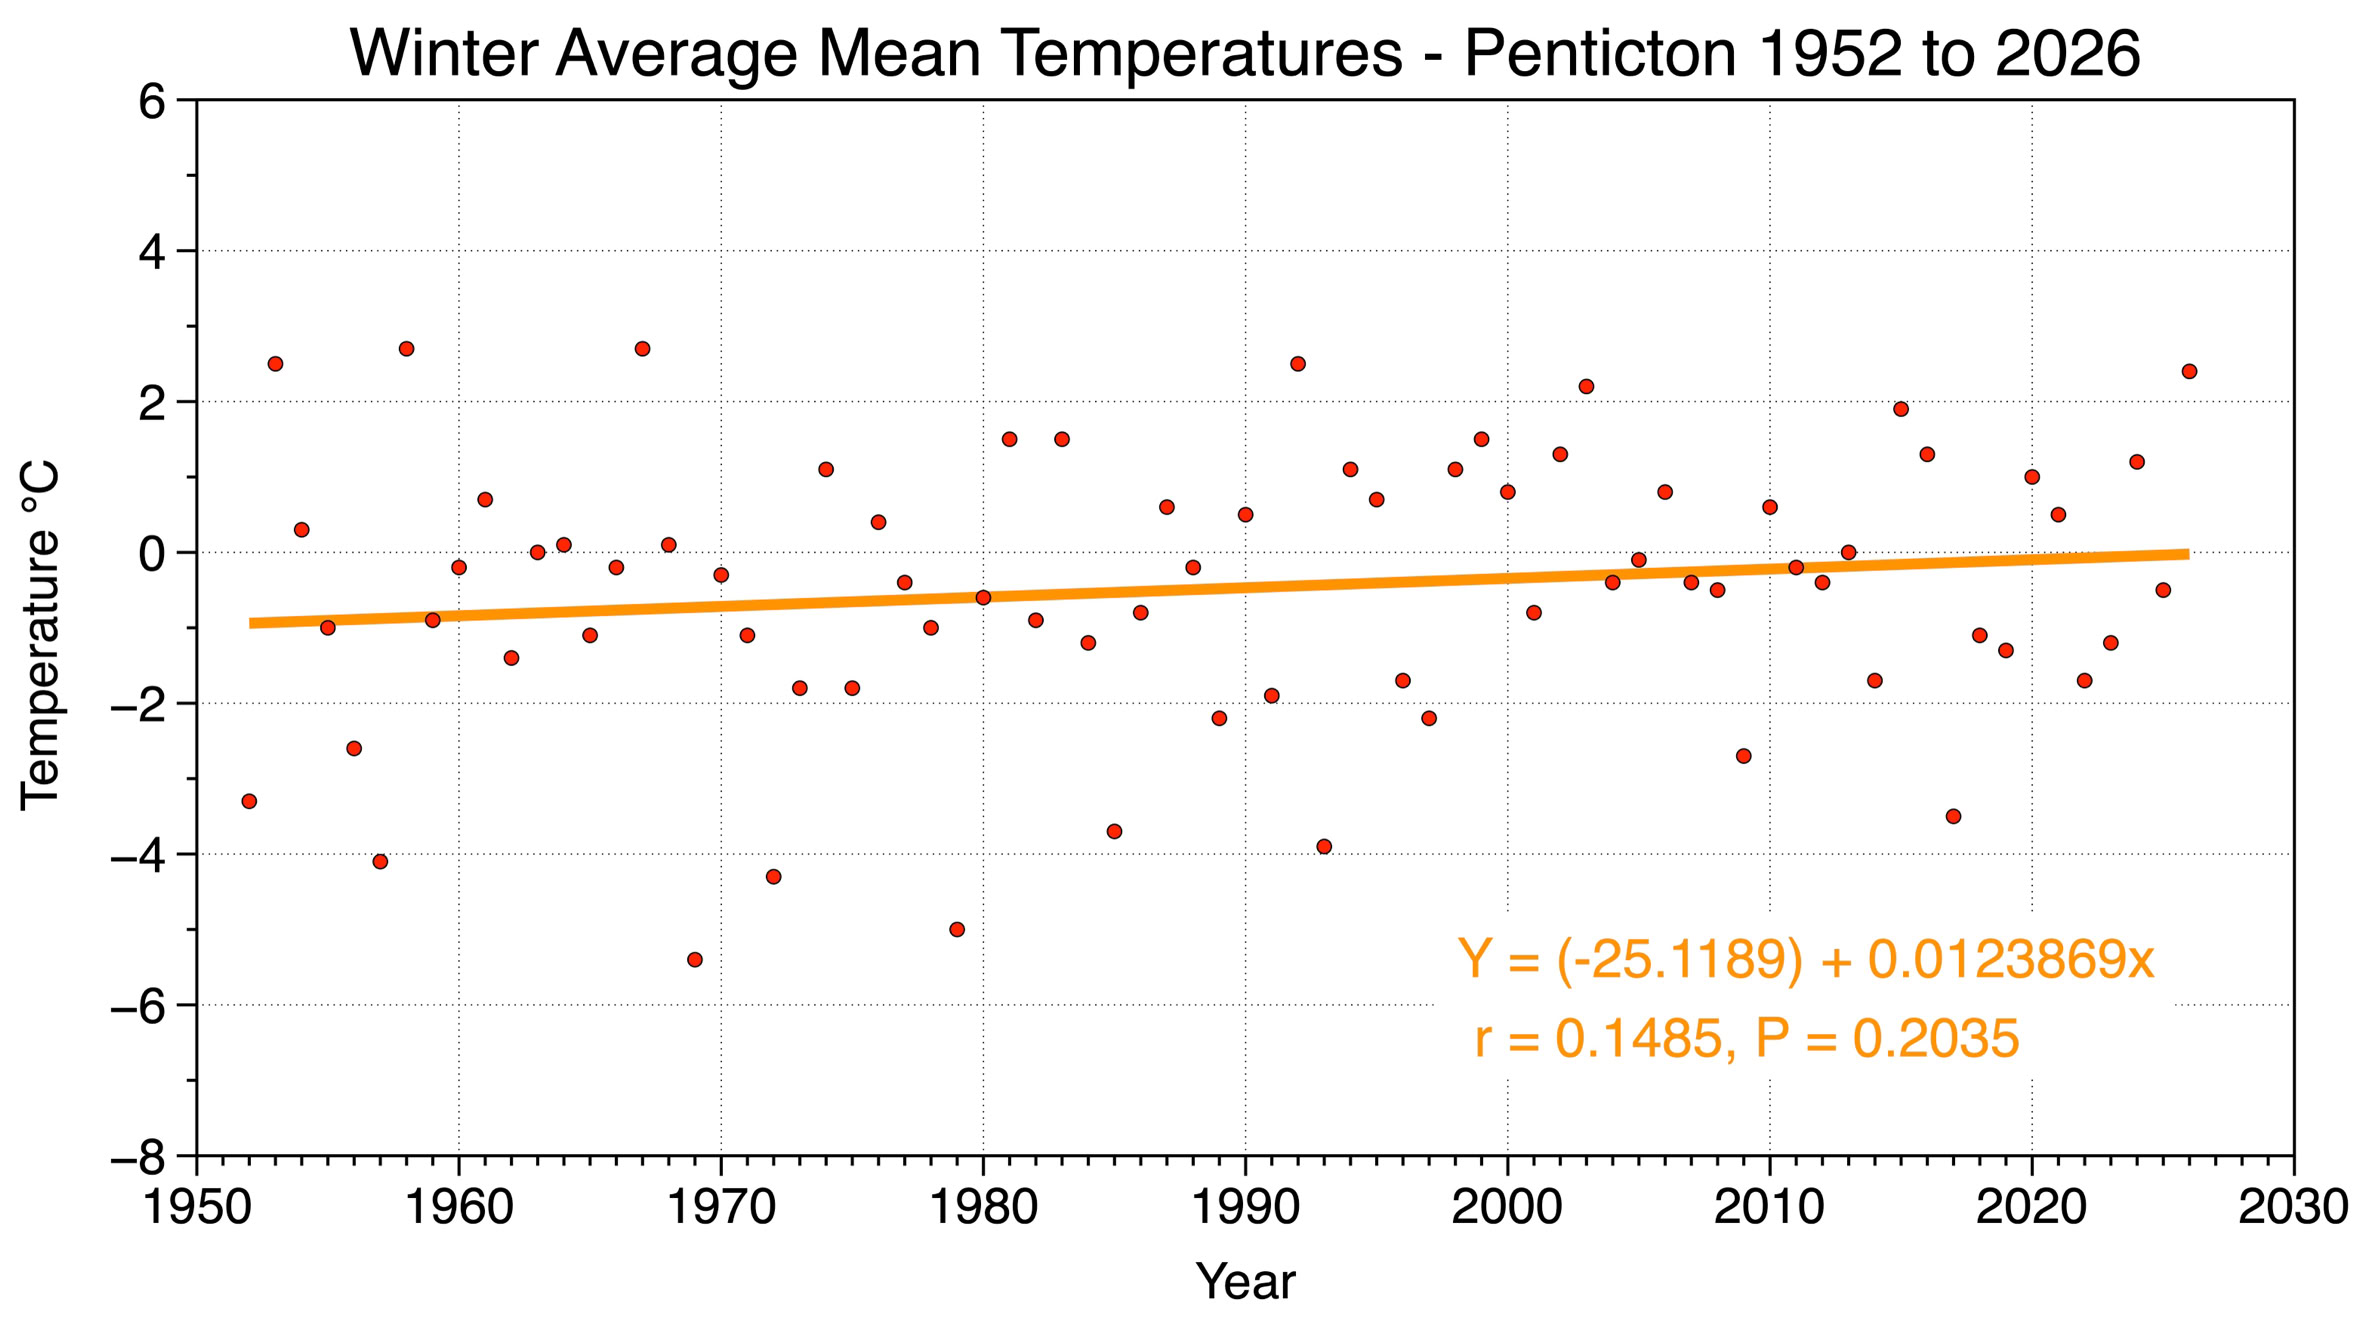
Figure 8 Penticton’s winter average mean temperatures from 1952 to 2026. Winter average mean temperature has been increasing at a rate of 0.12°C per decade according to linear regression analysis. This increase was not found to be statistically significant.
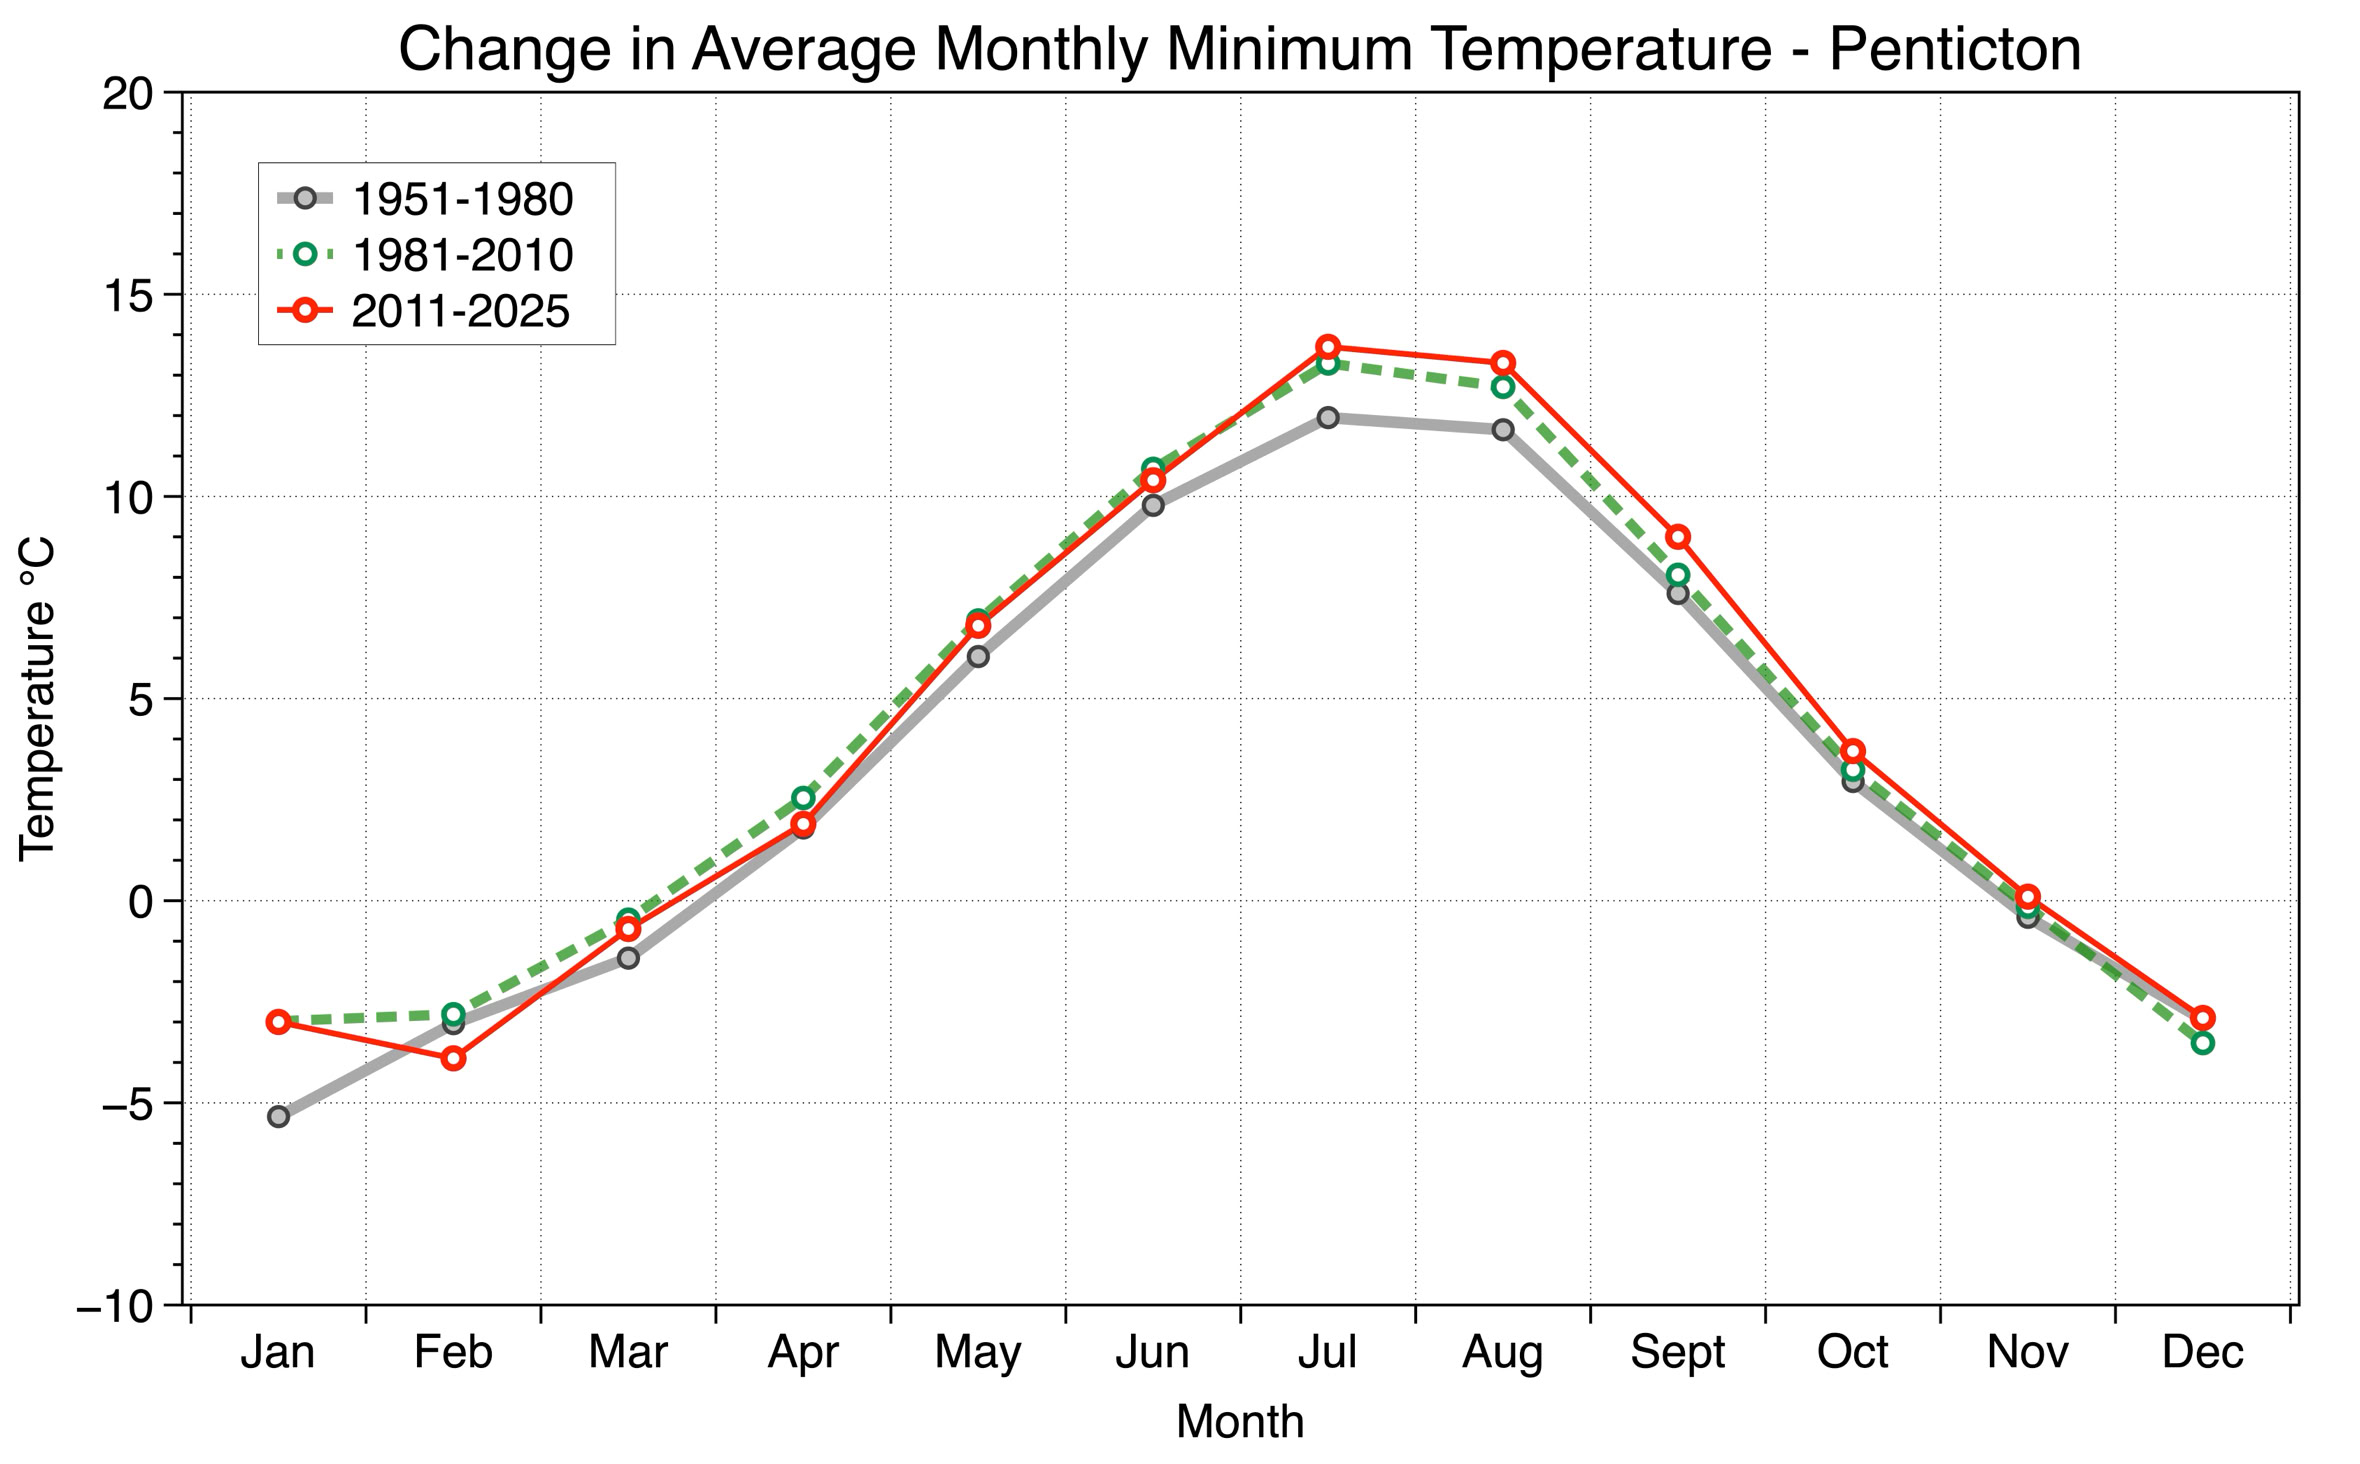
Figure 9 The historical change in average monthly minimum temperatures for three periods: 1951 to 1980, 1981 to 2010, and 2011 to 2025.
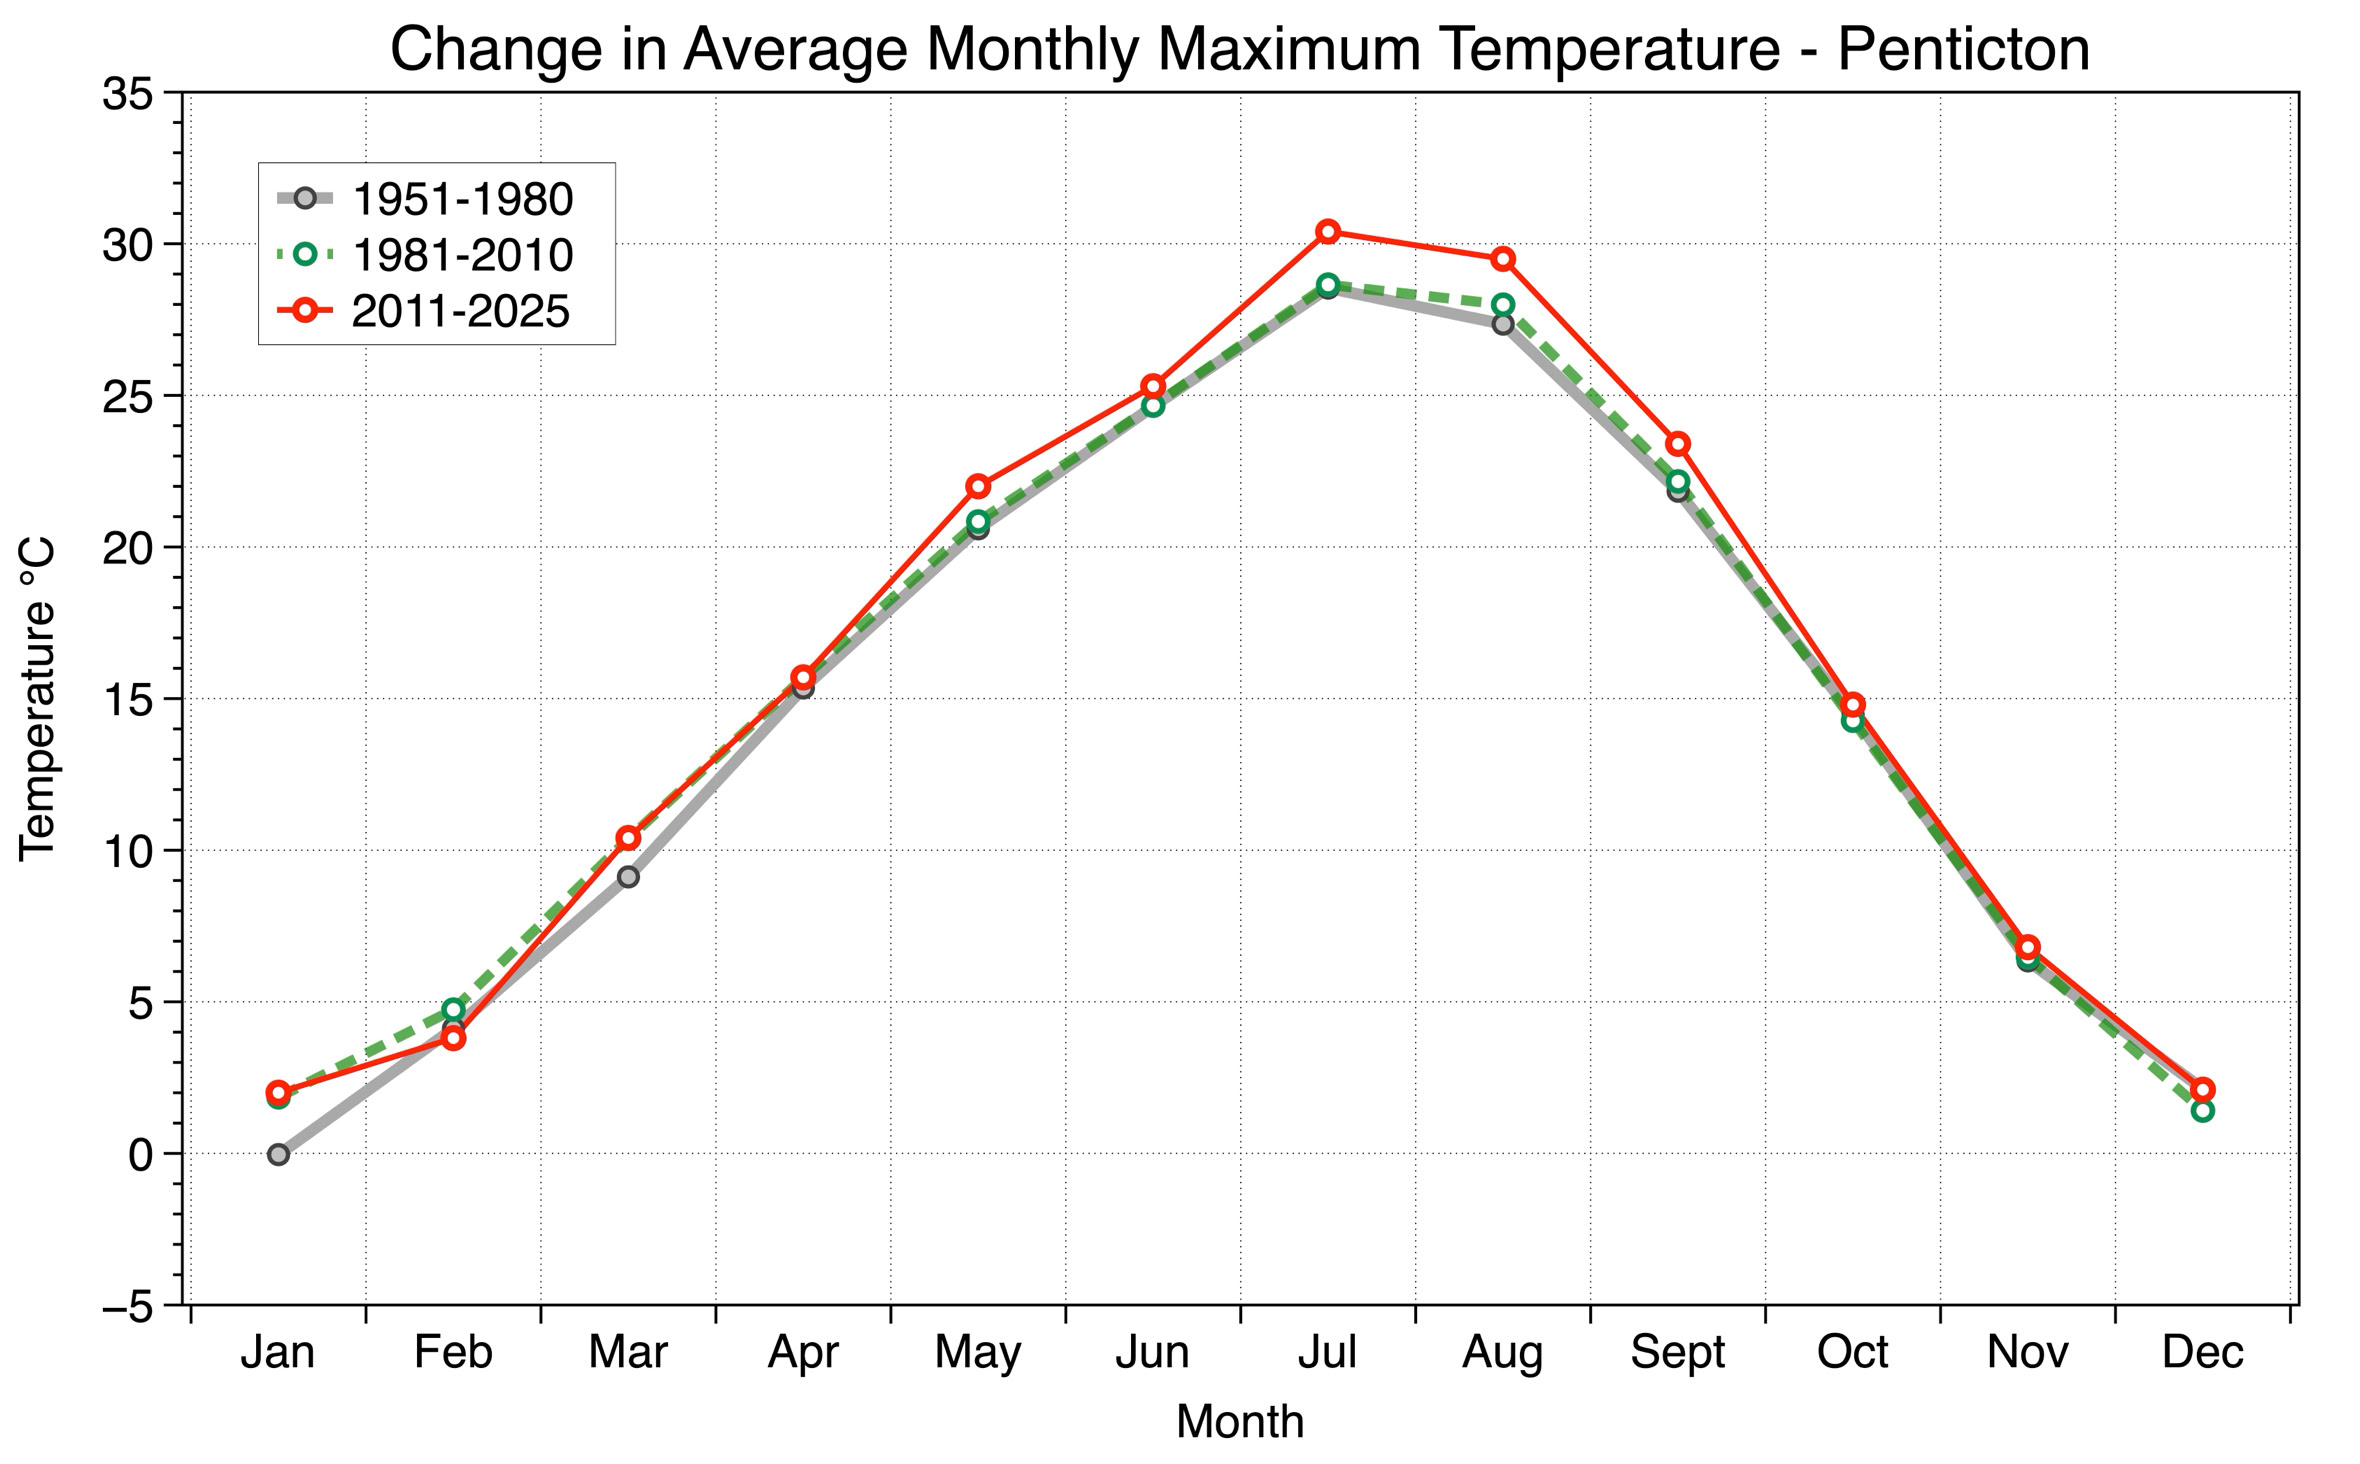
Figure 10 The historical change in average monthly maximum temperatures for three periods: 1951 to 1980, 1981 to 2010, and 2011 to 2025.
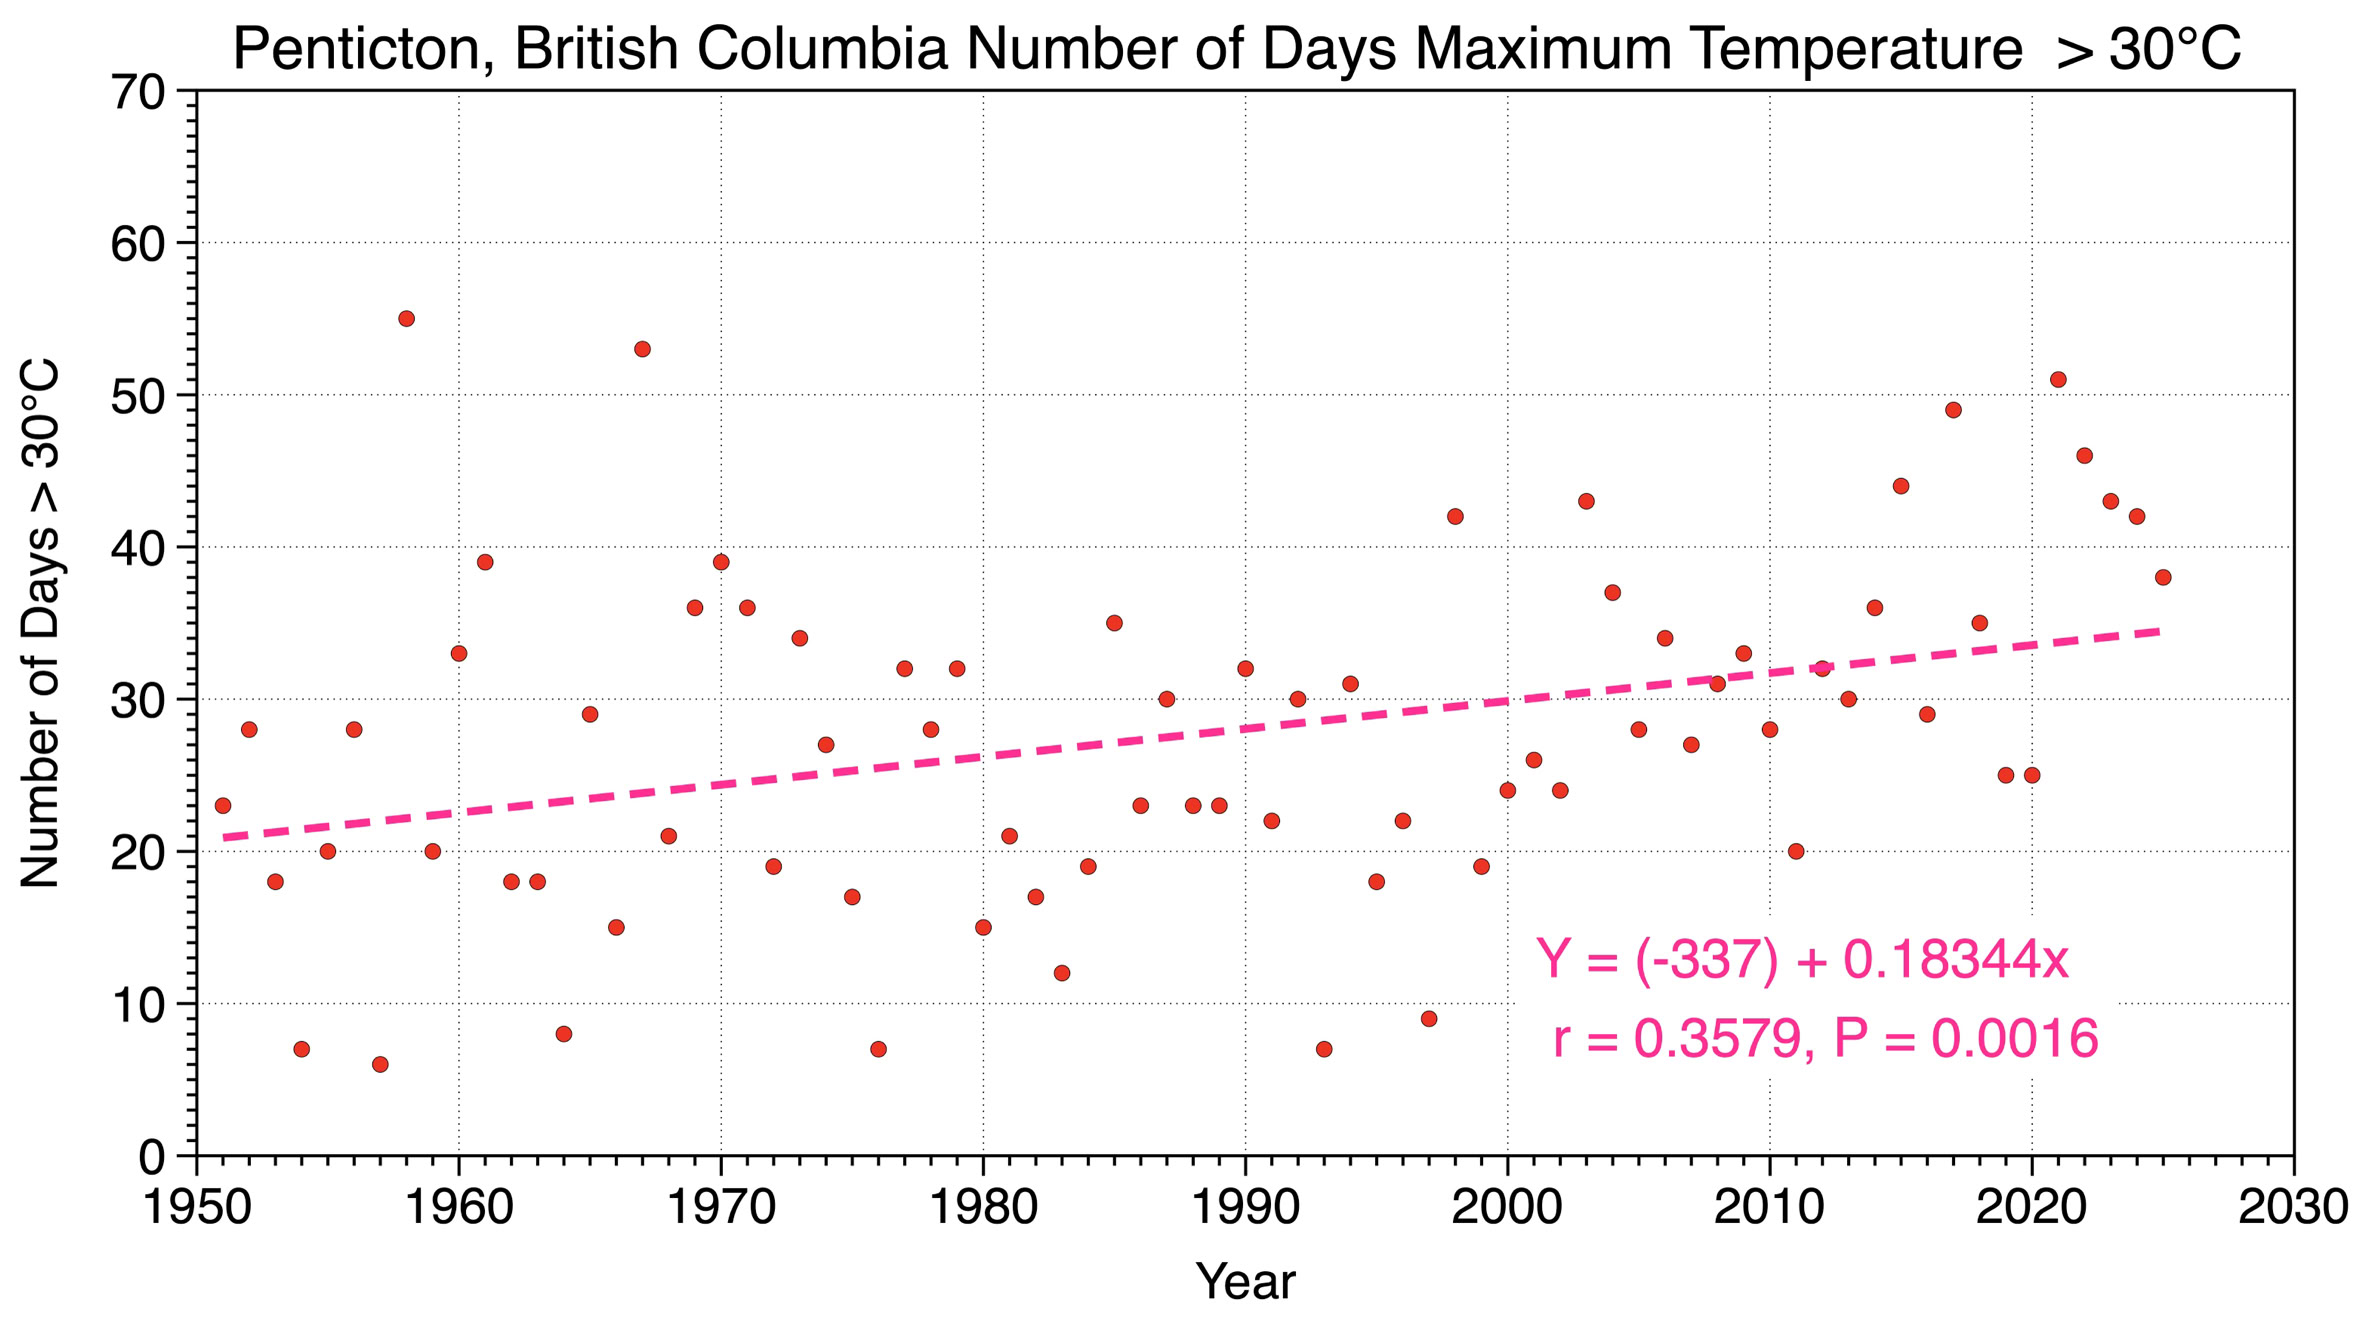
Figure 11 Yearly number of maximum daily temperature events > 30°C from 1951 to 2025 in Penticton. Maximum daily temperature events > 30°C have been steadily increasing at a rate of about 1.8 days per decade according to linear regression analysis.
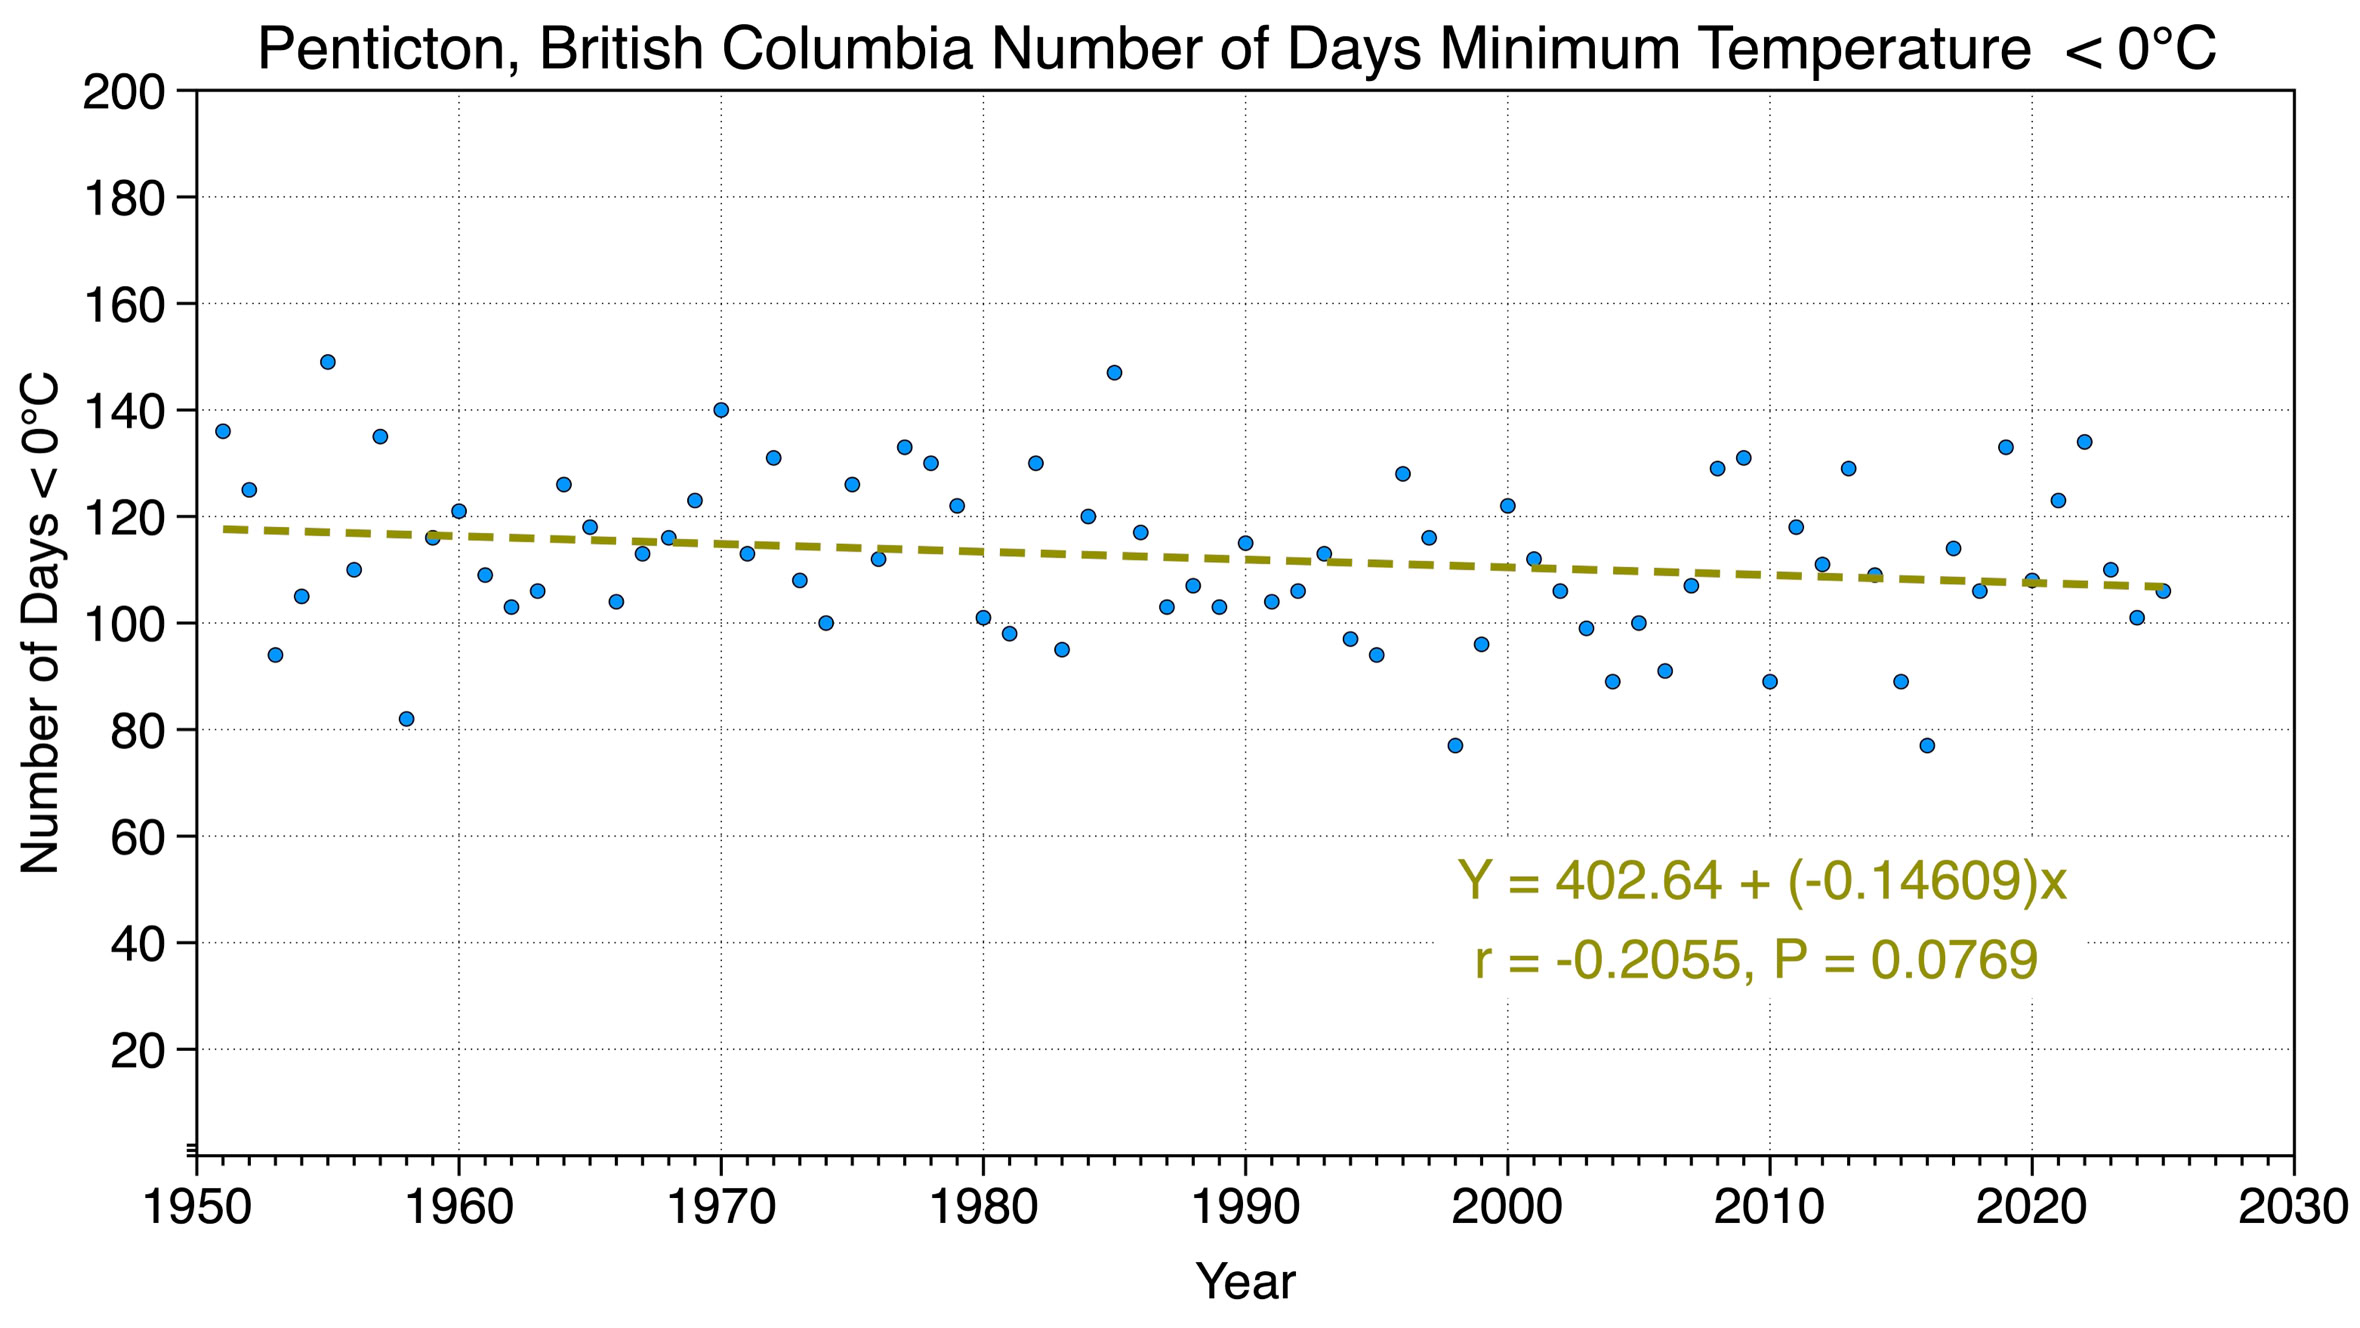
Figure 12 Yearly number of minumum daily temperature events < 0°C from 1951 to 2025 in Penticton. Minimum daily temperature events < 0°C have been steadily decreasing at a rate of about 1.5 days per decade according to linear regression analysis.
Copyright © 2026 Michael Pidwirny